Free Access
Fig. 3
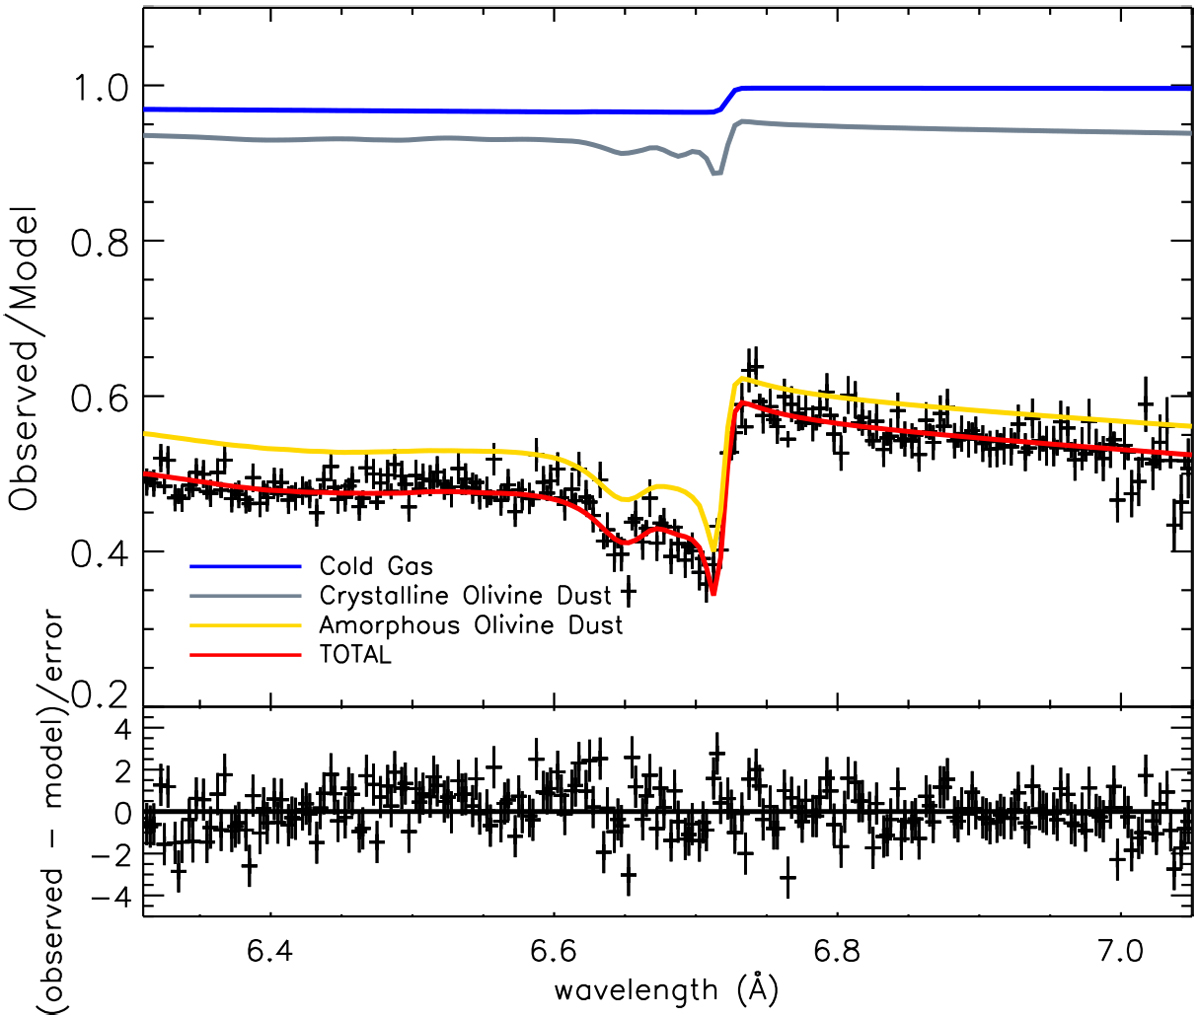
Fit of the Si K-edge of X-ray binary GX 5-1. The best fitting dust mixture is shown by the yellow line (amorphous olivine, sample 8) and the gray line (crystalline olivine dust, sample 1). The cold gas contribution is shown by the blue line and the total (cold gas and dust) by the red line.
Current usage metrics show cumulative count of Article Views (full-text article views including HTML views, PDF and ePub downloads, according to the available data) and Abstracts Views on Vision4Press platform.
Data correspond to usage on the plateform after 2015. The current usage metrics is available 48-96 hours after online publication and is updated daily on week days.
Initial download of the metrics may take a while.