Fig. B.2
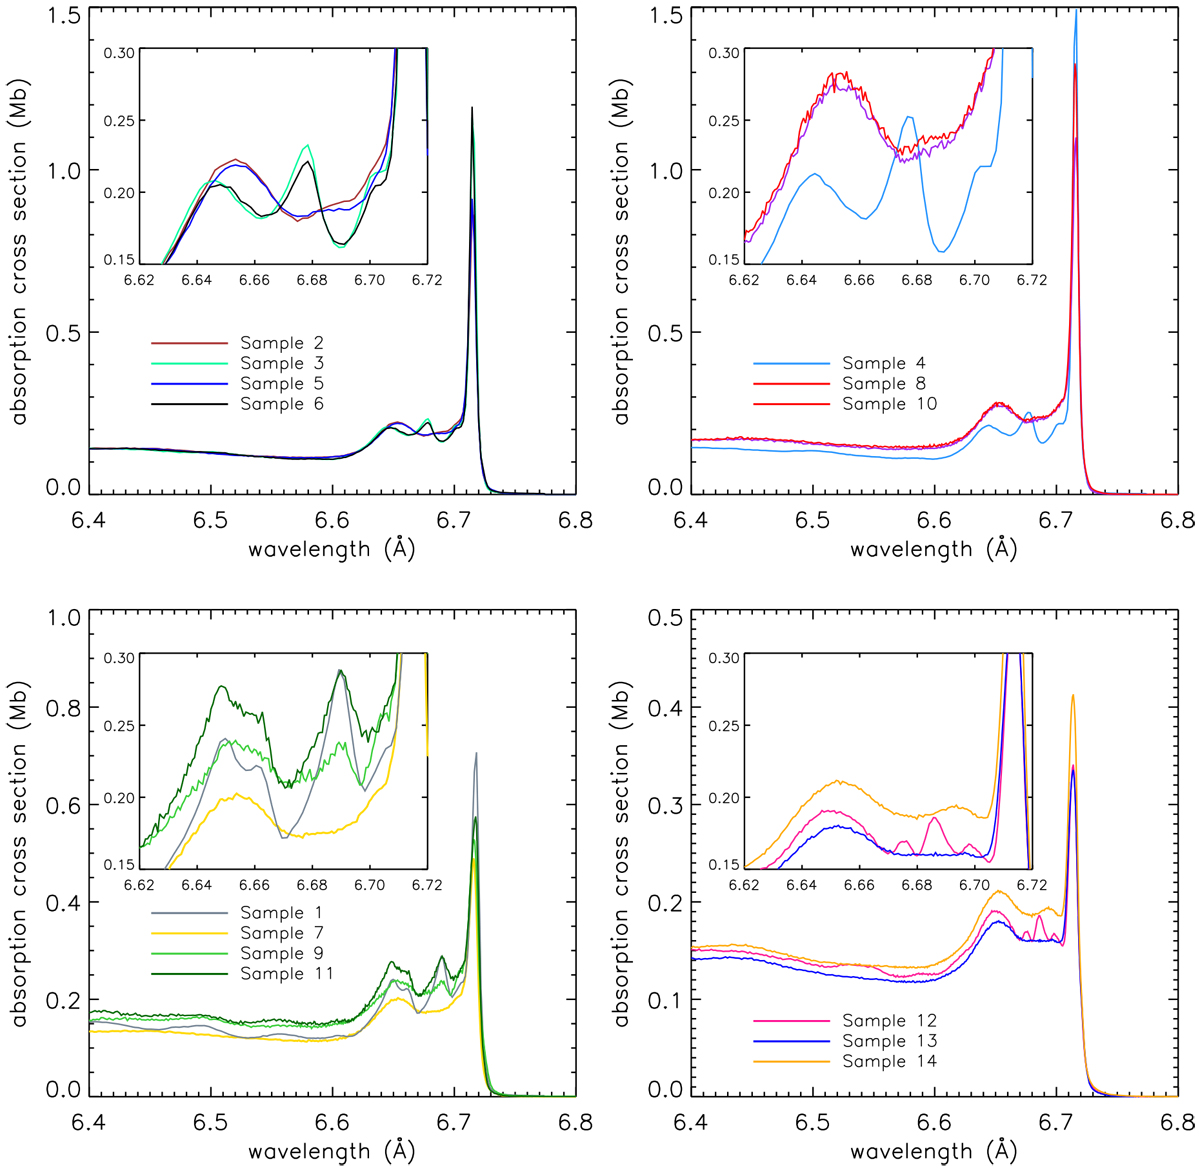
Si K-edge of dust samples 1–14 (see Table 1). The x-axis shows the energy in Å and the y-axis shows the amount of absorption indicated by the cross section (in Mb per Si atom). The samples are shown in different panels for easier comparison. Top left panel: difference between amorphous and crystalline pyroxenes (samples 2, 3, 5, and 6). Top right panel: difference between amorphous and crystalline enstatite (samples 4 and 10), including an amorphous pyroxene. Bottom left panel: olivine dust samples. Bottom right panel: our three quartz samples.
Current usage metrics show cumulative count of Article Views (full-text article views including HTML views, PDF and ePub downloads, according to the available data) and Abstracts Views on Vision4Press platform.
Data correspond to usage on the plateform after 2015. The current usage metrics is available 48-96 hours after online publication and is updated daily on week days.
Initial download of the metrics may take a while.