Open Access
Fig. 8.
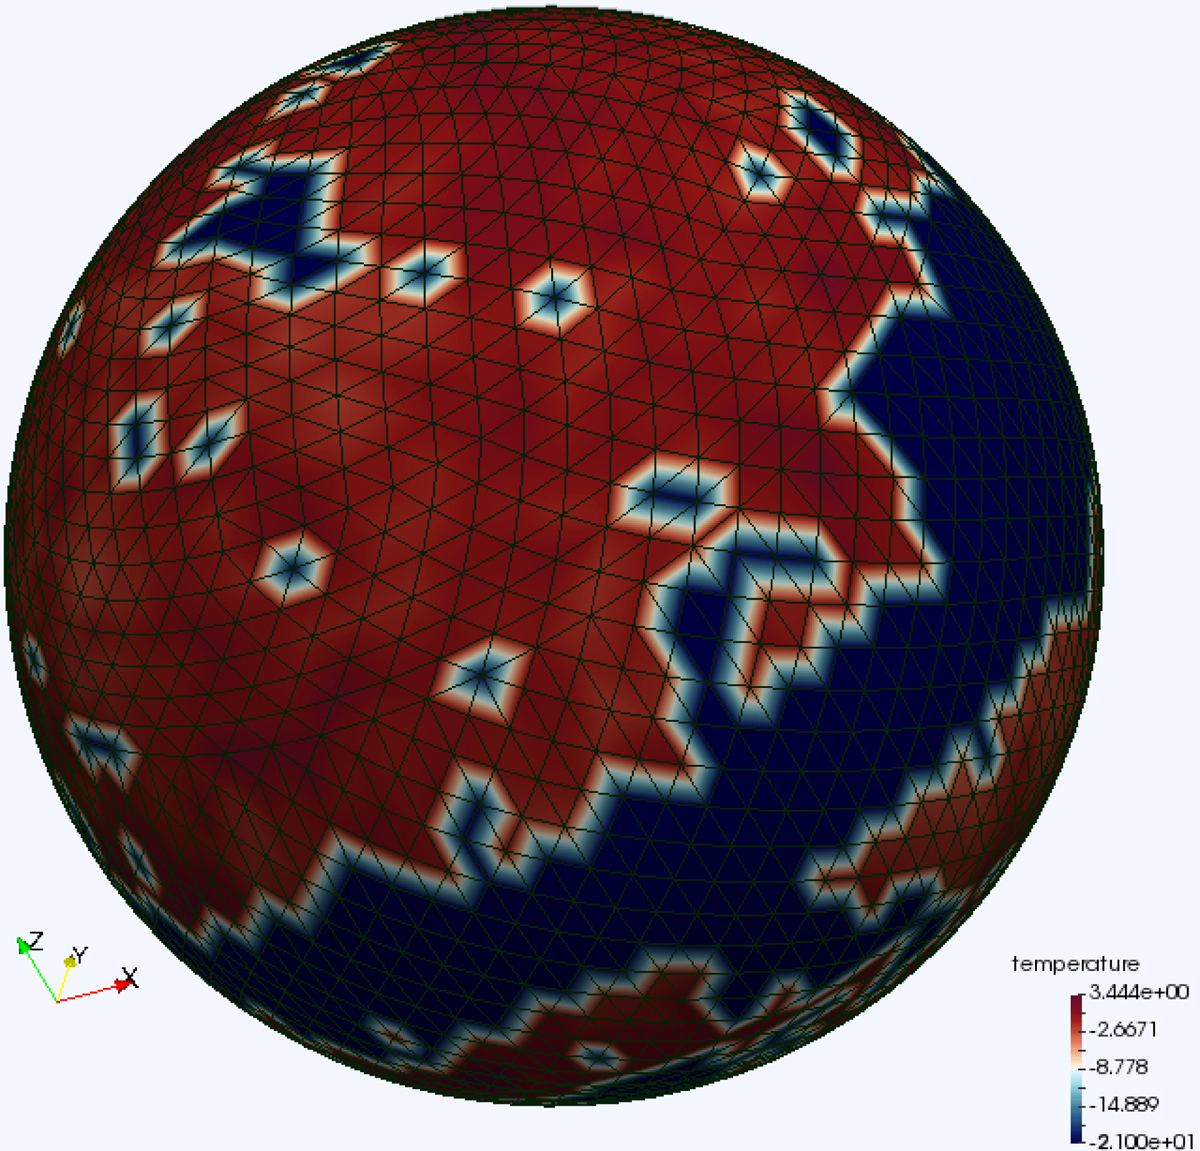
Visualization of the temperature field for the NILC observed maps at N = 16. Also visible is the corresponding triangulation, for which the pixel centres of the maps serve as the vertices. The temperature values are stored in the vertices of this triangulation.
Current usage metrics show cumulative count of Article Views (full-text article views including HTML views, PDF and ePub downloads, according to the available data) and Abstracts Views on Vision4Press platform.
Data correspond to usage on the plateform after 2015. The current usage metrics is available 48-96 hours after online publication and is updated daily on week days.
Initial download of the metrics may take a while.