Fig. 2.
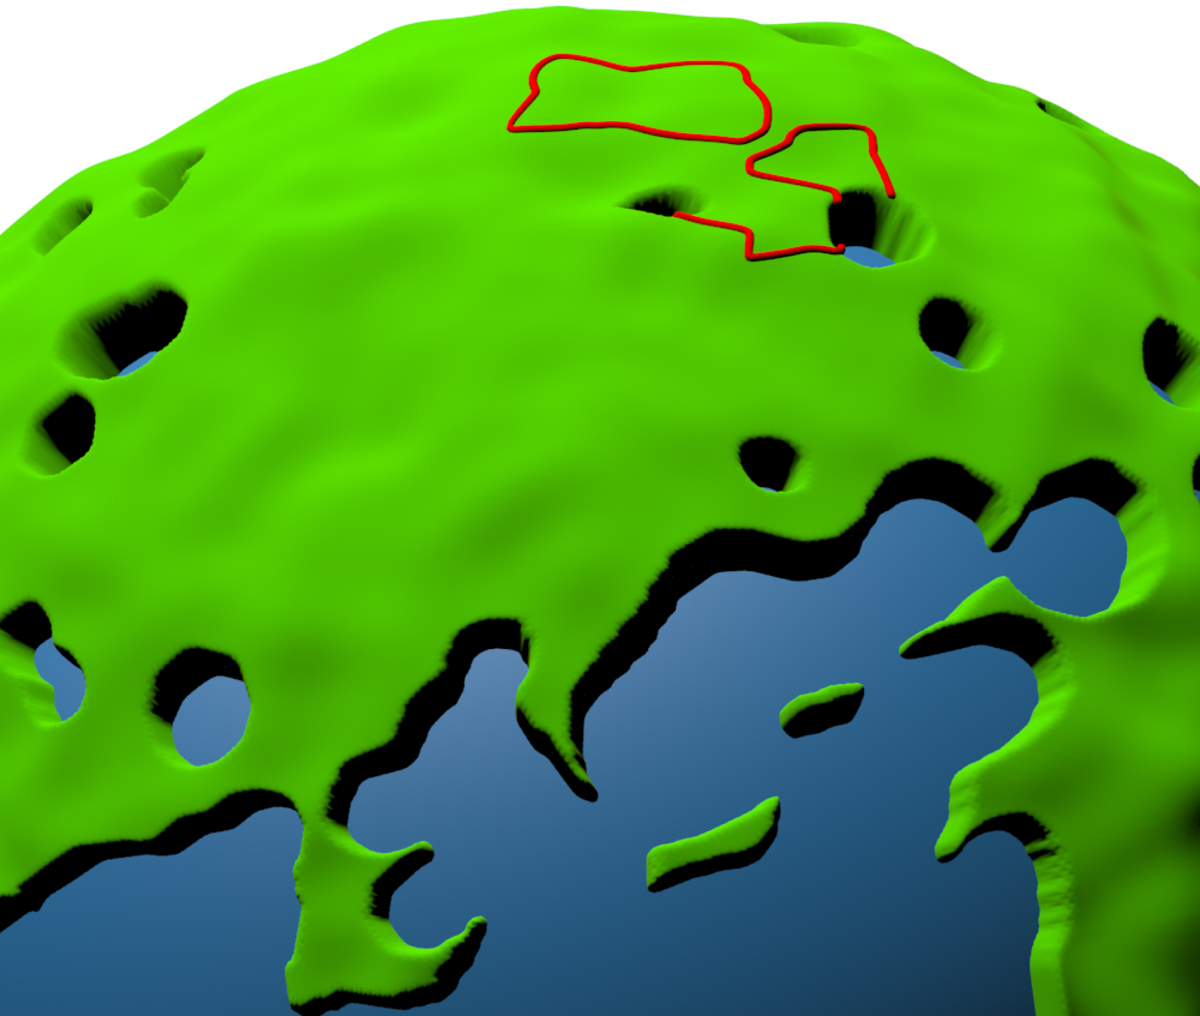
Small section of the sphere of directions, with the temperature field visualized by the green landscape that complements the blue mask drawn at lower altitude. We see one closed loop surrounding a relative depression of the temperature field, and two open loops connecting points in the mask along locally highest paths. The visualization is based on the observed CMB maps cleaned using the NILC technique, and smoothed at 4°.
Current usage metrics show cumulative count of Article Views (full-text article views including HTML views, PDF and ePub downloads, according to the available data) and Abstracts Views on Vision4Press platform.
Data correspond to usage on the plateform after 2015. The current usage metrics is available 48-96 hours after online publication and is updated daily on week days.
Initial download of the metrics may take a while.