Open Access
Fig. 12.
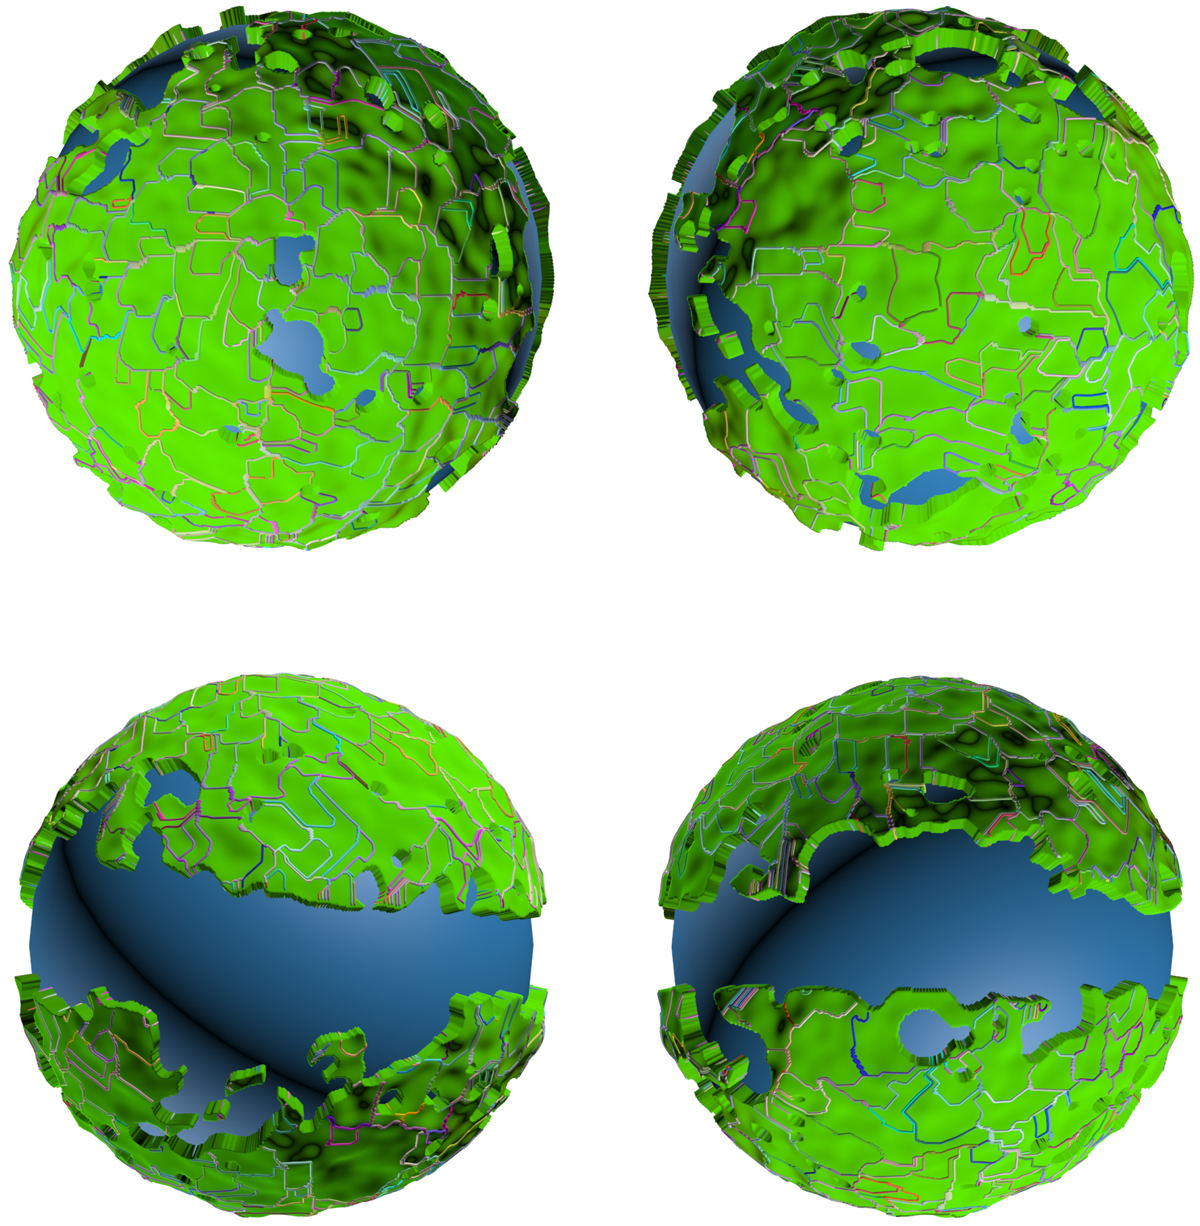
Visualization of the loops for the largest excursion set, which consists of the entire sphere minus the mask. To improve the visualization, the temperature field has been smoothed by a small amount, and we do not draw very short loops. From left to right: the sphere from the top, the bottom, the left, and the right views.
Current usage metrics show cumulative count of Article Views (full-text article views including HTML views, PDF and ePub downloads, according to the available data) and Abstracts Views on Vision4Press platform.
Data correspond to usage on the plateform after 2015. The current usage metrics is available 48-96 hours after online publication and is updated daily on week days.
Initial download of the metrics may take a while.