Fig. 10.
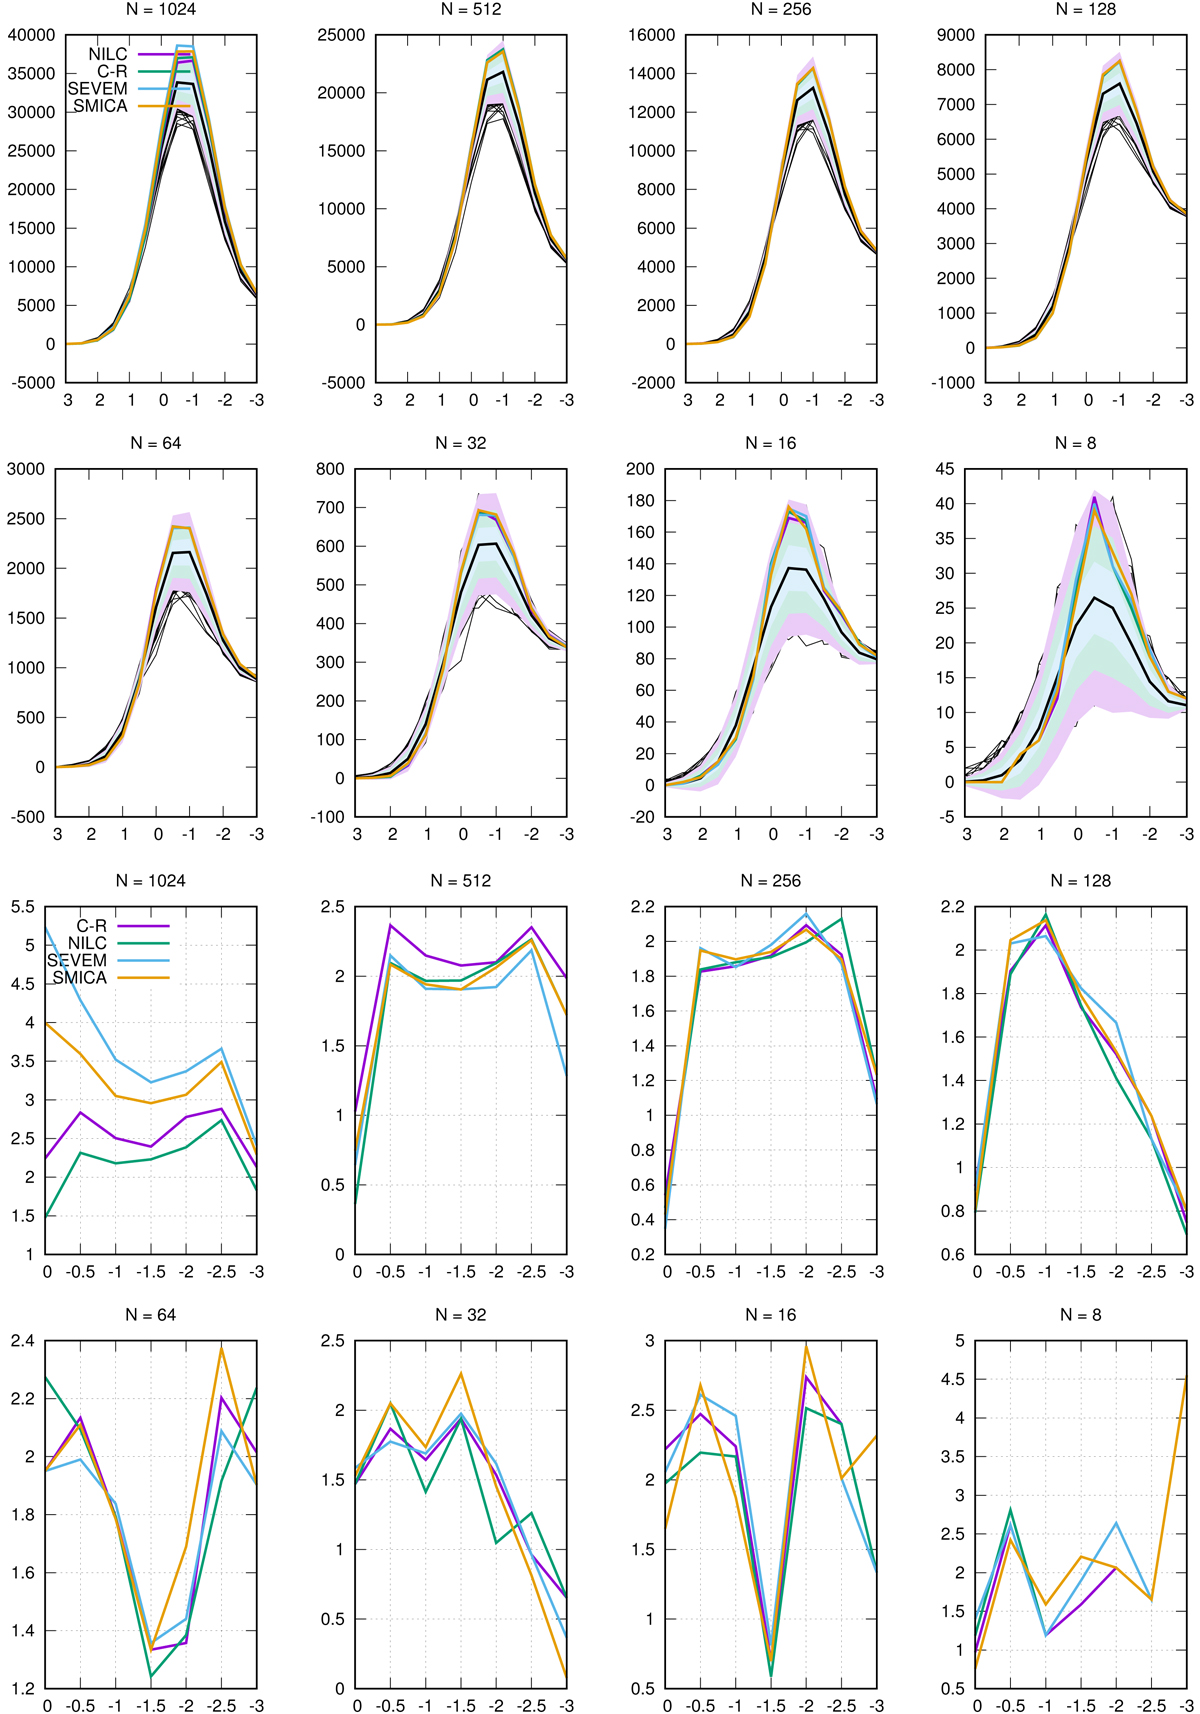
b1 graphs for resolutions between N = 1024 and N = 8. Top two rows: observed curve obtained using NILC, C-R, SEVEM, and SMICA methods, and the expected (black) curve computed from 1000 NILC simulations, along with bands drawn up to 3σ. Also plotted underneath are the 1000 curves from individual simulations. Bottom two rows: curve presenting the difference between the observations and simulations in terms of the number of standard deviations for the various temperature thresholds. Maximum noted deviation is at N = 8 at 4.5σ. It is difficult to judge the validity of this number, as the low temperature threshold (ν = −3) entails a low total number of objects on which the statistics are based. The next peak in the curve is located at a moderate threshold (ν = −0.5), and indicates a deviation at 2.9σ. The threshold along the horizontal axis runs from positive to negative, in view of the fact that we analyse superlevel sets of the normalized temperature field.
Current usage metrics show cumulative count of Article Views (full-text article views including HTML views, PDF and ePub downloads, according to the available data) and Abstracts Views on Vision4Press platform.
Data correspond to usage on the plateform after 2015. The current usage metrics is available 48-96 hours after online publication and is updated daily on week days.
Initial download of the metrics may take a while.