Fig. A.1.
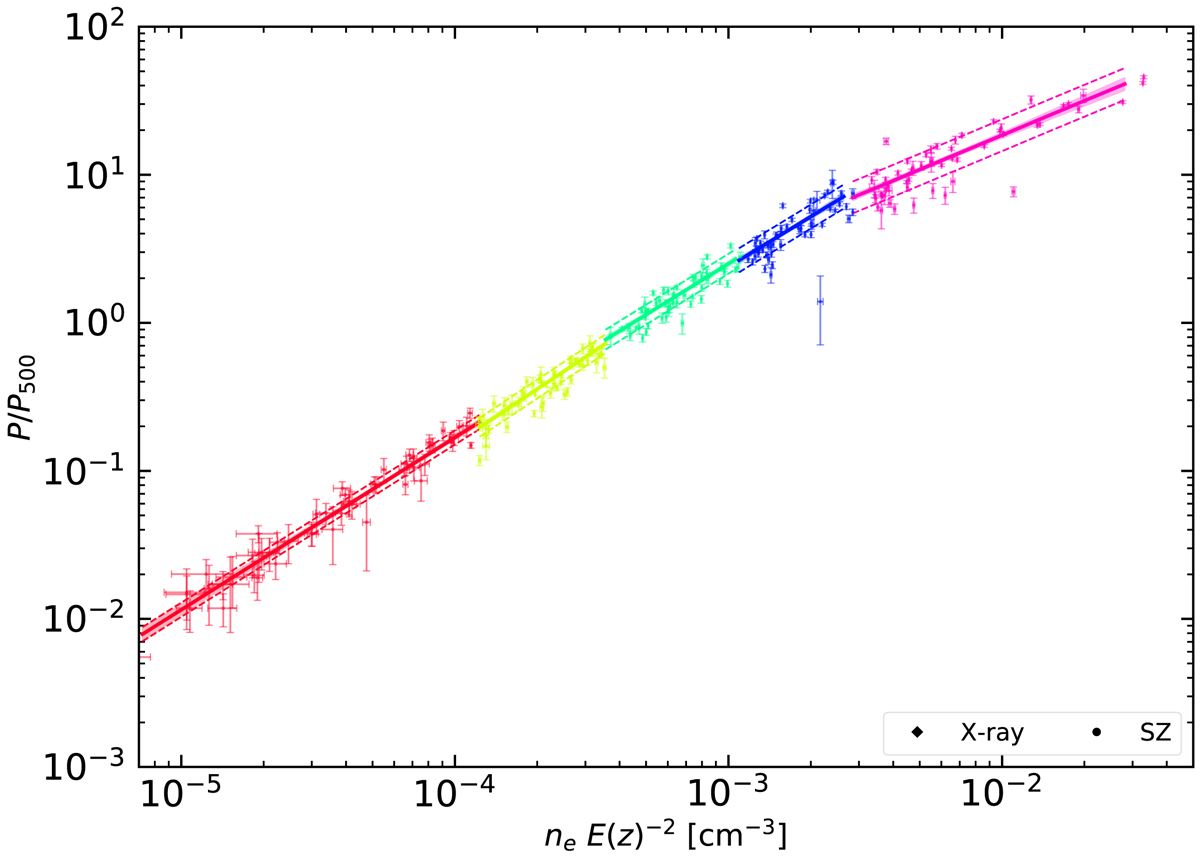
Piecewise power-law fit of the gas pressure versue density (best-fit values quoted in Table 1). Solid lines and contour indicate the best fitting result with statistical uncertainties; dashed lines indicate the intrinsic scatter in the distribution around the best fit. The different colors correspond to different density range, where these ranges have been chosen to have the same number of points within them.
Current usage metrics show cumulative count of Article Views (full-text article views including HTML views, PDF and ePub downloads, according to the available data) and Abstracts Views on Vision4Press platform.
Data correspond to usage on the plateform after 2015. The current usage metrics is available 48-96 hours after online publication and is updated daily on week days.
Initial download of the metrics may take a while.