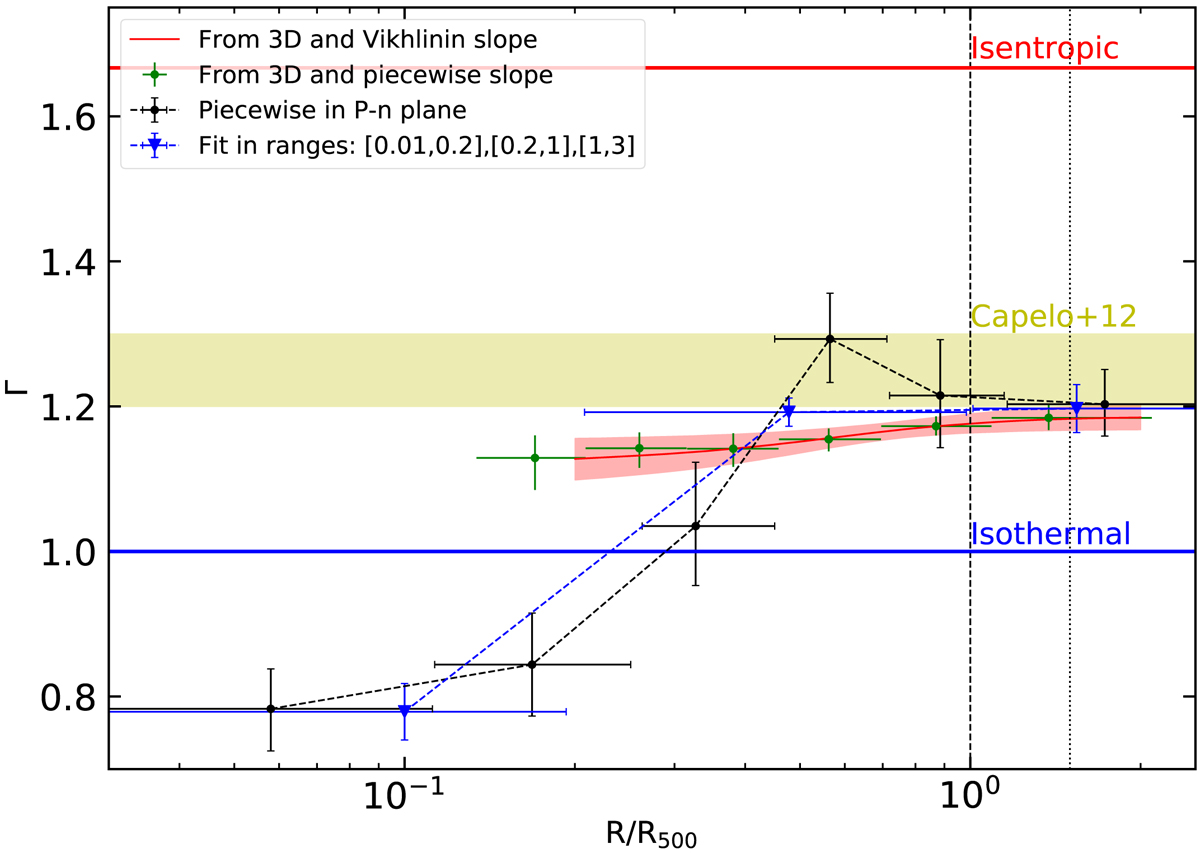
Fig. 4.

Effective polytropic index as function of radius. Black data points represent the results of the piecewise fit from Eq. (1). Also the blue data points come from a piecewise analysis, but with radii chosen a posteriori. The red curve and green points indicate the polytropic index estimated from our combined analysis (see Sect. 4), the difference being in the slope of the density considered (see text after Eq. (7)). The horizontal blue and red lines indicate the location of the isothermal and isentropic limits, respectively. The horizontal yellow stripe represents the value predicted by numerical simulations, as the green stripe in Fig. 2. The vertical dashed and dotted lines represent the location of R500 and R200, respectively.
Current usage metrics show cumulative count of Article Views (full-text article views including HTML views, PDF and ePub downloads, according to the available data) and Abstracts Views on Vision4Press platform.
Data correspond to usage on the plateform after 2015. The current usage metrics is available 48-96 hours after online publication and is updated daily on week days.
Initial download of the metrics may take a while.


