Fig. 3.
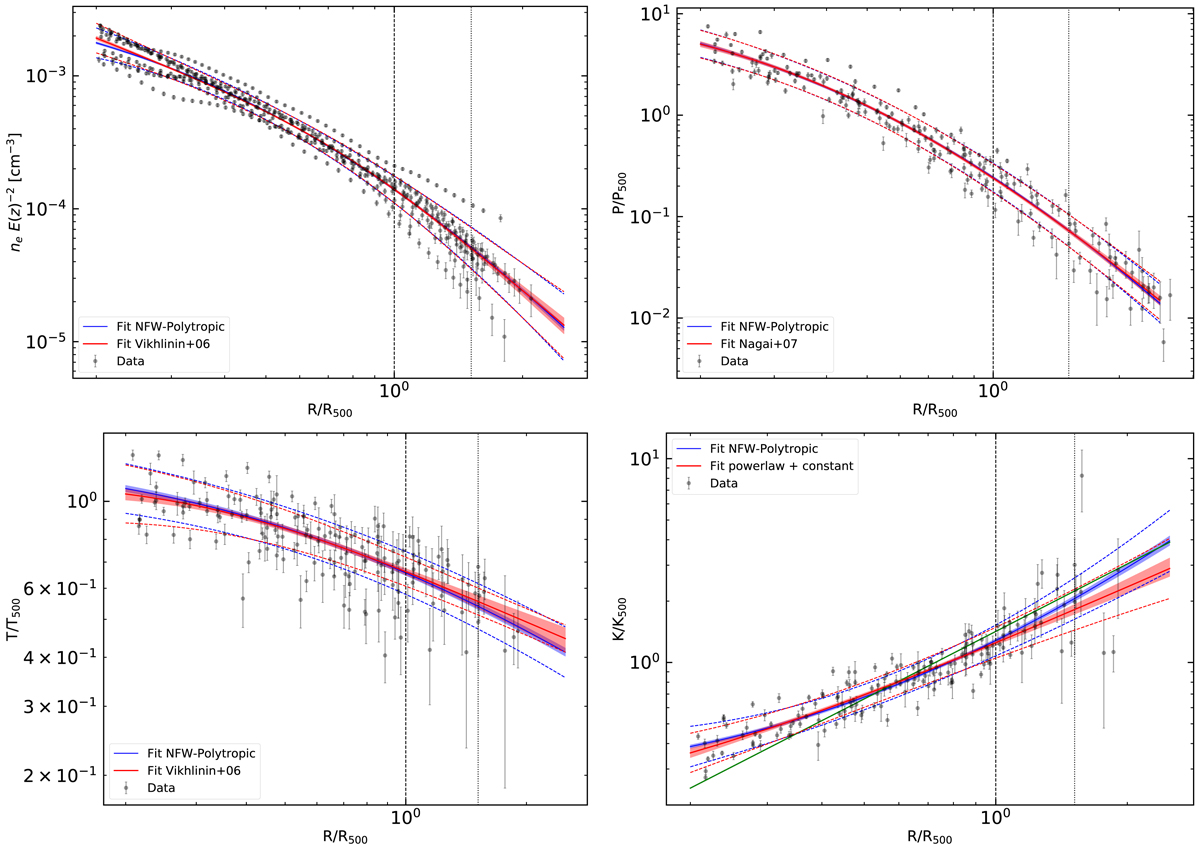
Profiles of the (top) electron density and pressure, (bottom) temperature and entropy with, overplotted in blue, the joint fit obtained using the NFW-polytropic functional forms relating together the parameters c500 and Γ (see Table 3 and Sect. 3), and, in red, the functional form used in Ghirardini et al. (2019). The shaded area around the functional form represents the 1σ confidence level on the best fit, while the dashed lines represents the scatter around the best fit. The vertical dashed and dotted lines represent the location of R500 and R200, respectively.
Current usage metrics show cumulative count of Article Views (full-text article views including HTML views, PDF and ePub downloads, according to the available data) and Abstracts Views on Vision4Press platform.
Data correspond to usage on the plateform after 2015. The current usage metrics is available 48-96 hours after online publication and is updated daily on week days.
Initial download of the metrics may take a while.