Fig. 6
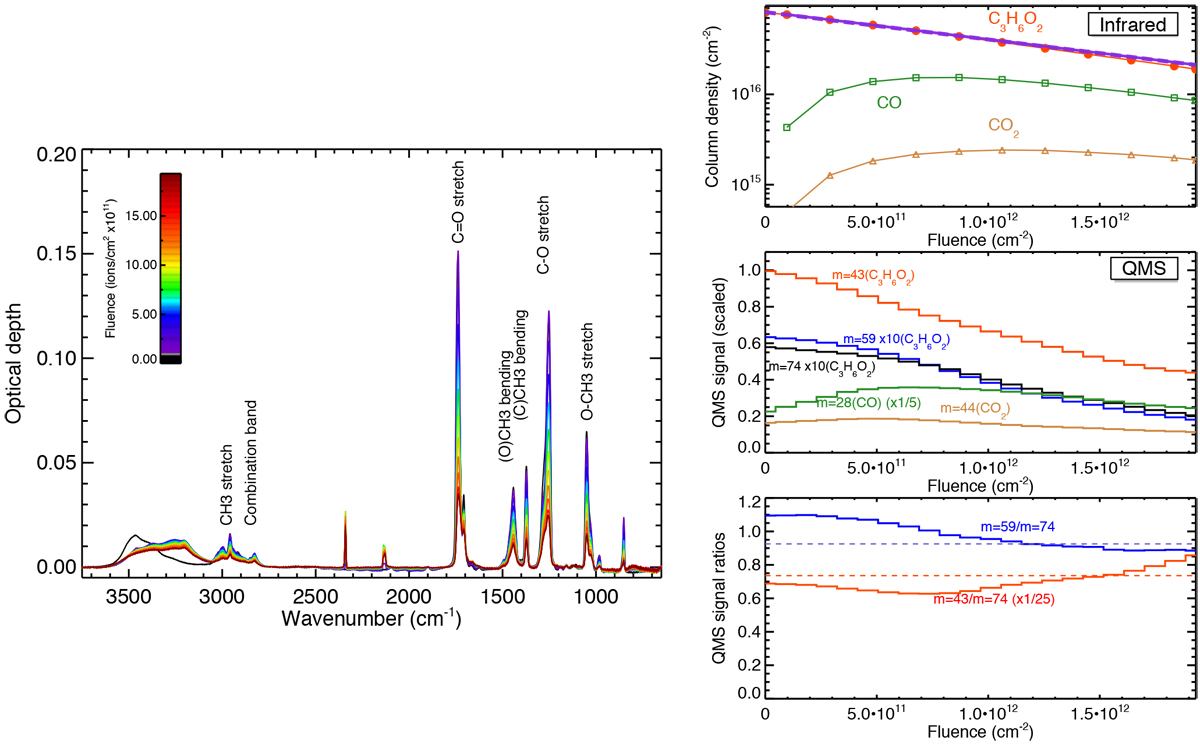
Left: CH3COOCH3 ice-film experiment. Right, top panel: ice column density measurements from IR spectra. Middle panel: QMS-scaled intensities at selected masses we used to follow carbon dioxide (m = 44), methyl acetate (m = 74, 59, 43, 29, 15), and CO (m = 28) during irradiation. Lower panel: QMS signal ratios of the m = 43 (CH3CO) and m = 59 (CH3COO) biggest fragments to the m = 74 (ionised CH3COOCH3) are shown as a function of irradiation (full lines). The ratios stay reasonably constant, with a value close to the pre-irradiation value (dotted lines). See text for details.
Current usage metrics show cumulative count of Article Views (full-text article views including HTML views, PDF and ePub downloads, according to the available data) and Abstracts Views on Vision4Press platform.
Data correspond to usage on the plateform after 2015. The current usage metrics is available 48-96 hours after online publication and is updated daily on week days.
Initial download of the metrics may take a while.