Fig. 3
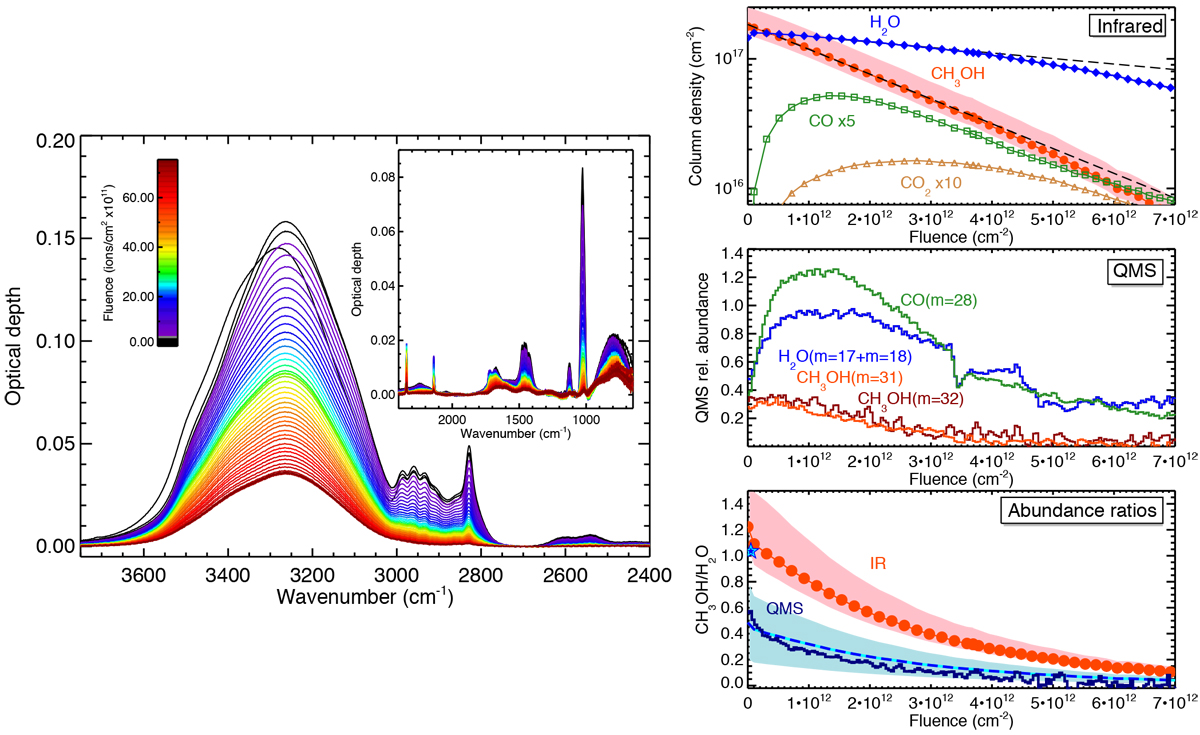
Left: H2O:CH3OH (100:122) ice film. Evolution of the IR spectra as a function of fluence. Right, top panel: ice column density measurements from IR spectra. The black dashed lines represent the fits to the destruction cross section of water and methanol. Middle panel: QMS-normalised signals we used to follow the relative abundance of water (m = 17+m = 18), methanol (m = 32 and m = 31), and carbon monoxide (m = 28) upon irradiation. See text for details. m = 28 increases atthe beginning because it is mainly composed of fragments from the radiolytic products of the initial ice mixture. Lower panel: CH3OH/H2O abundance ratio deduced from the IR spectra of the ice film as a function of fluence (red dots, the uncertainty is filled in in red). Comparison with the QMS-determined abundance ratio of the same desorbed molecules (dark blue line, from m = 32+m = 31 for methanoland m = 17+m = 18 for water). The blue and cyan star indicates the gas ratio measurement with the QMS during the ice film deposition. The dashed blue and cyan line represents Eq. (6); the uncertainty is filled in blue.
Current usage metrics show cumulative count of Article Views (full-text article views including HTML views, PDF and ePub downloads, according to the available data) and Abstracts Views on Vision4Press platform.
Data correspond to usage on the plateform after 2015. The current usage metrics is available 48-96 hours after online publication and is updated daily on week days.
Initial download of the metrics may take a while.