Fig. 2
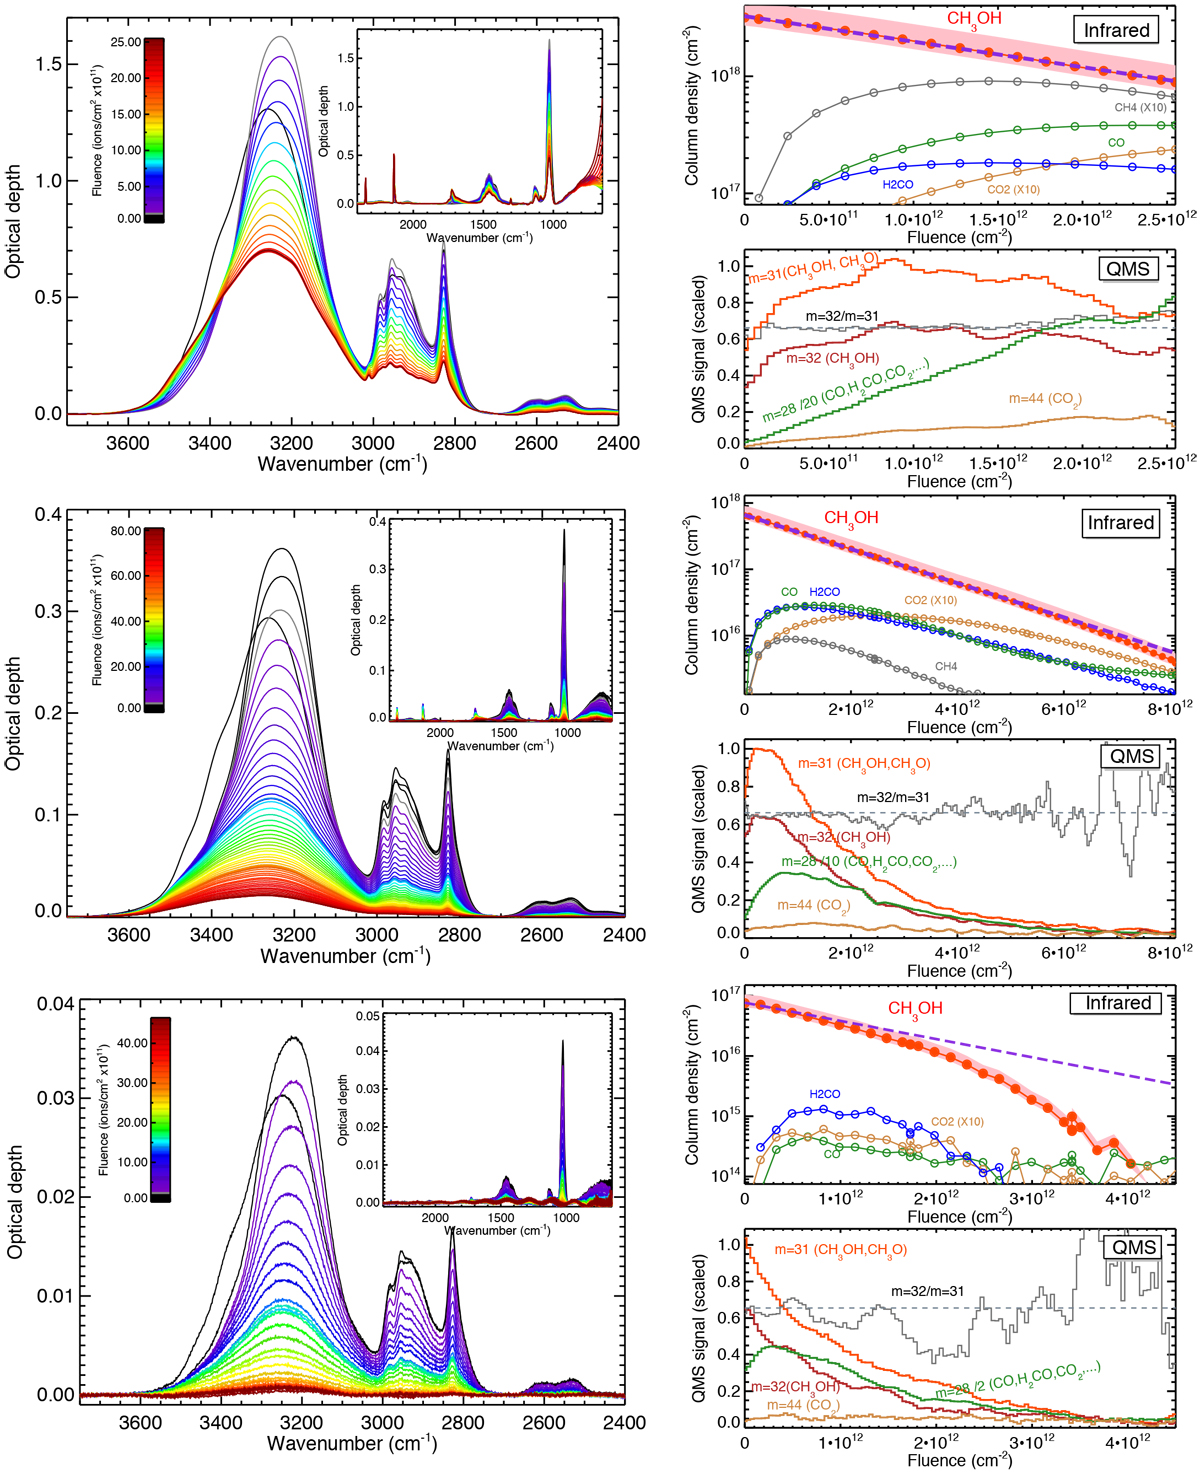
Pure methanol ice-film experiments with various initial film thicknesses (thick to thin from top to bottom). Left panels: evolution of the CH3OH IR spectra as a function of fluence. Right, top panels: ice column density measurements from IR spectra (circles). The column densities are estimated using the integrated cross sections from Table 2. The purple dashed line is the fit to the destruction cross section of methanol (top 5 ± 1 × 10⁻¹³ cm2 ion−1, middle 5.9 ± 1 × 10⁻¹³ cm2 ion−1). For the thinner film (bottom panels), the onset of dominant sputtering appears for a column density lower than ≈ 1016 cm−2. Right, lower panels: QMS scaled intensities at selected masses that were used to follow carbon dioxide m = 44, methanol m = 32, m = 31, and m = 28 (CO, H2CO, and CO2) during irradiation. The mass-pattern ratio for methanol m = 32/m = 31 (grey curves) is compared to the ratio measured for pure methanol during the ice-film preparation (dotted line). See text for details.
Current usage metrics show cumulative count of Article Views (full-text article views including HTML views, PDF and ePub downloads, according to the available data) and Abstracts Views on Vision4Press platform.
Data correspond to usage on the plateform after 2015. The current usage metrics is available 48-96 hours after online publication and is updated daily on week days.
Initial download of the metrics may take a while.