Fig. 10
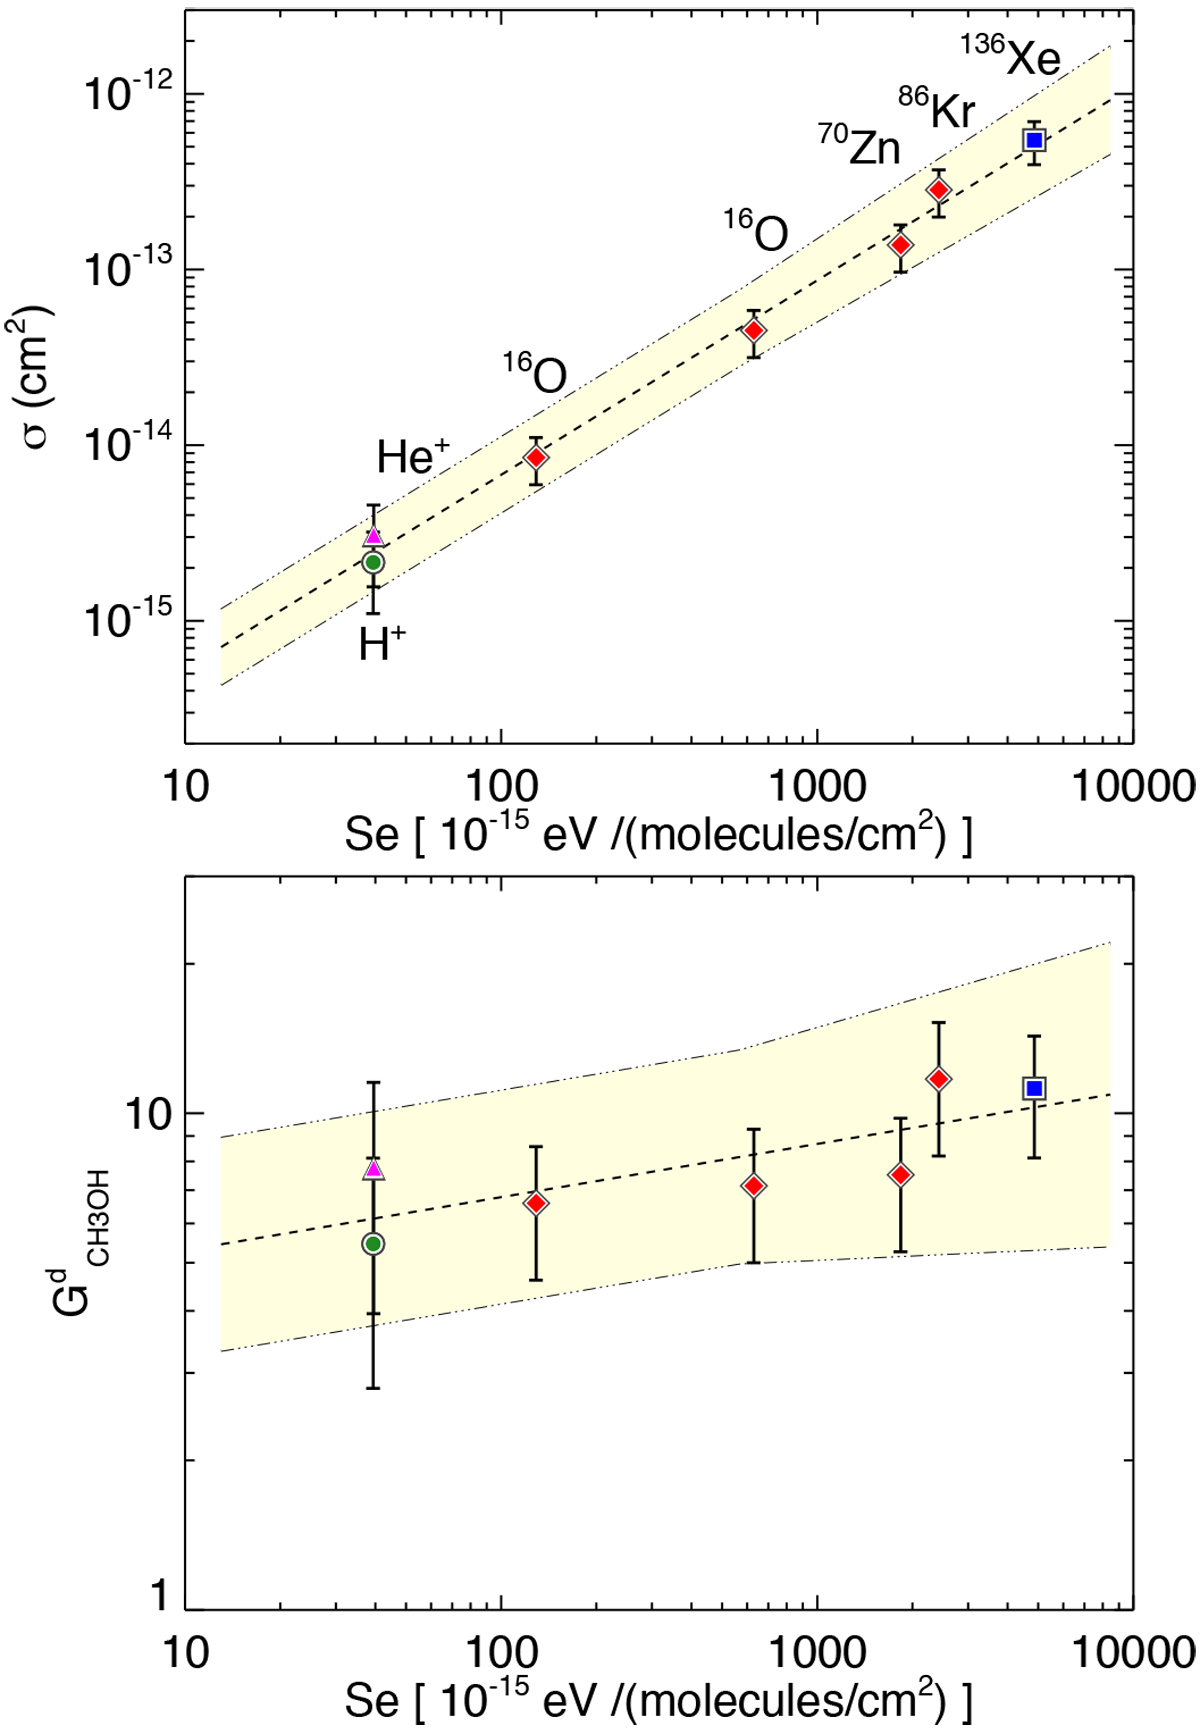
Upper panel: methanol destruction cross section as a function of stopping power in the electron regime. Red diamonds show data from de Barros et al. (2011), the magenta triangle represents 30 keV He+ (Baratta et al. 2002), the green circle shows 200 keV H+ (Brunetto et al. 2005), and the blue square shows data from this work. The dashed line represent the best least-squares fit to the cross section, and the filled region delineates the 95% interval confidence. See text for details. Lower panel: corresponding methanol radiochemical destruction yield.
Current usage metrics show cumulative count of Article Views (full-text article views including HTML views, PDF and ePub downloads, according to the available data) and Abstracts Views on Vision4Press platform.
Data correspond to usage on the plateform after 2015. The current usage metrics is available 48-96 hours after online publication and is updated daily on week days.
Initial download of the metrics may take a while.