Fig. 1
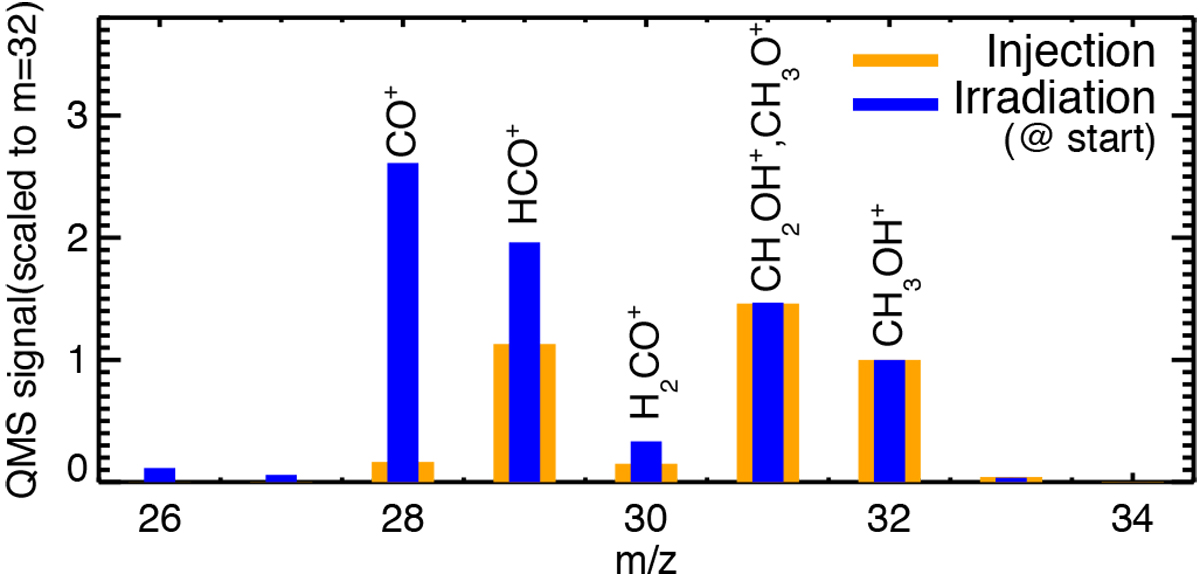
Average of the mass spectra that were recorded during the methanol injection that was meant to form the ice film (orangehistogram), tracing the QMS mass-fragmentation pattern of pure methanol; average of a few spectra that were recorded at the beginning of the ice-film irradiation (blue histogram). Both mass spectra are scaled to mass 32 for comparison.This shows that masses 32 and 31 can be used to monitor methanol because the radiolysis with the ion mainly contributes to peaks at lower masses. See text for details.
Current usage metrics show cumulative count of Article Views (full-text article views including HTML views, PDF and ePub downloads, according to the available data) and Abstracts Views on Vision4Press platform.
Data correspond to usage on the plateform after 2015. The current usage metrics is available 48-96 hours after online publication and is updated daily on week days.
Initial download of the metrics may take a while.