Free Access
Fig. 12.
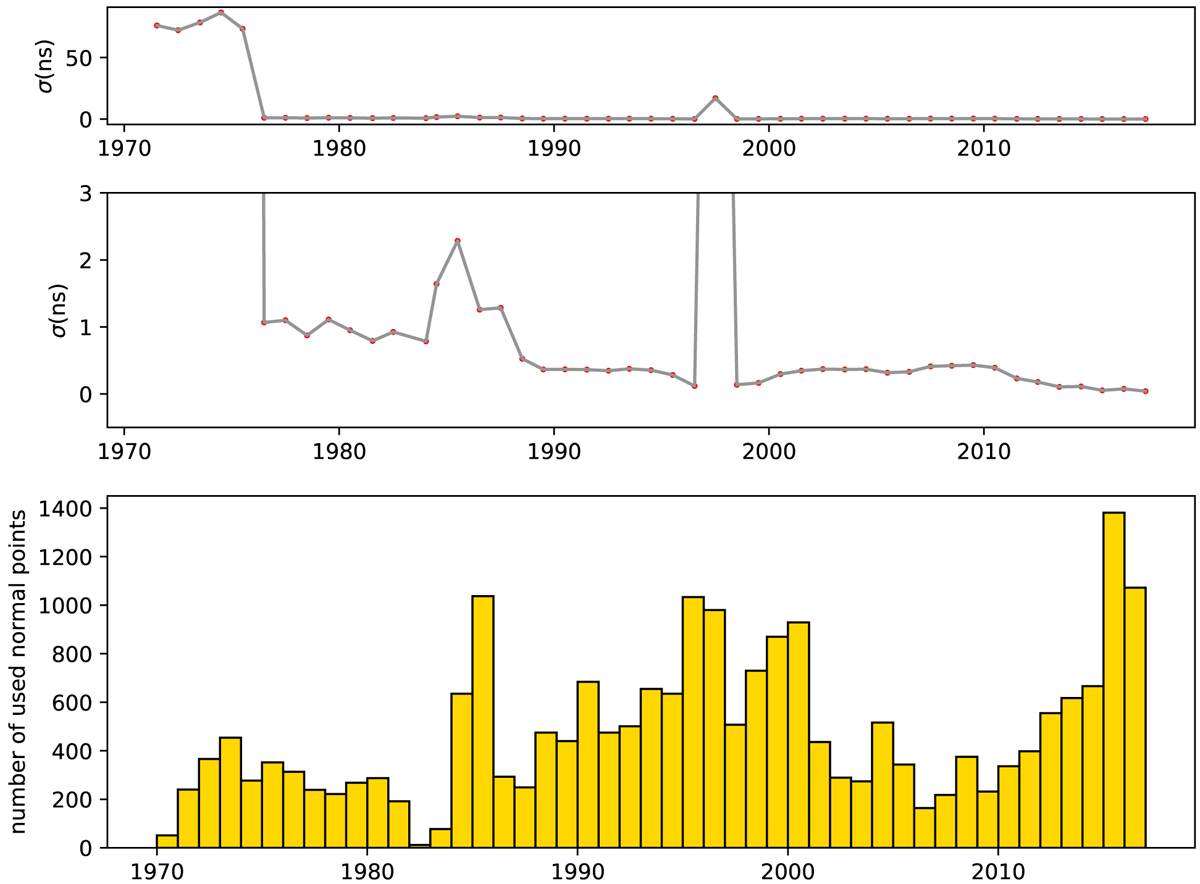
Time series of observational errors and number of used normal points; the second figure shows details of the first one. Each point or bin represents the weighted average of the total within a year.
Current usage metrics show cumulative count of Article Views (full-text article views including HTML views, PDF and ePub downloads, according to the available data) and Abstracts Views on Vision4Press platform.
Data correspond to usage on the plateform after 2015. The current usage metrics is available 48-96 hours after online publication and is updated daily on week days.
Initial download of the metrics may take a while.