Free Access
Fig. 8.
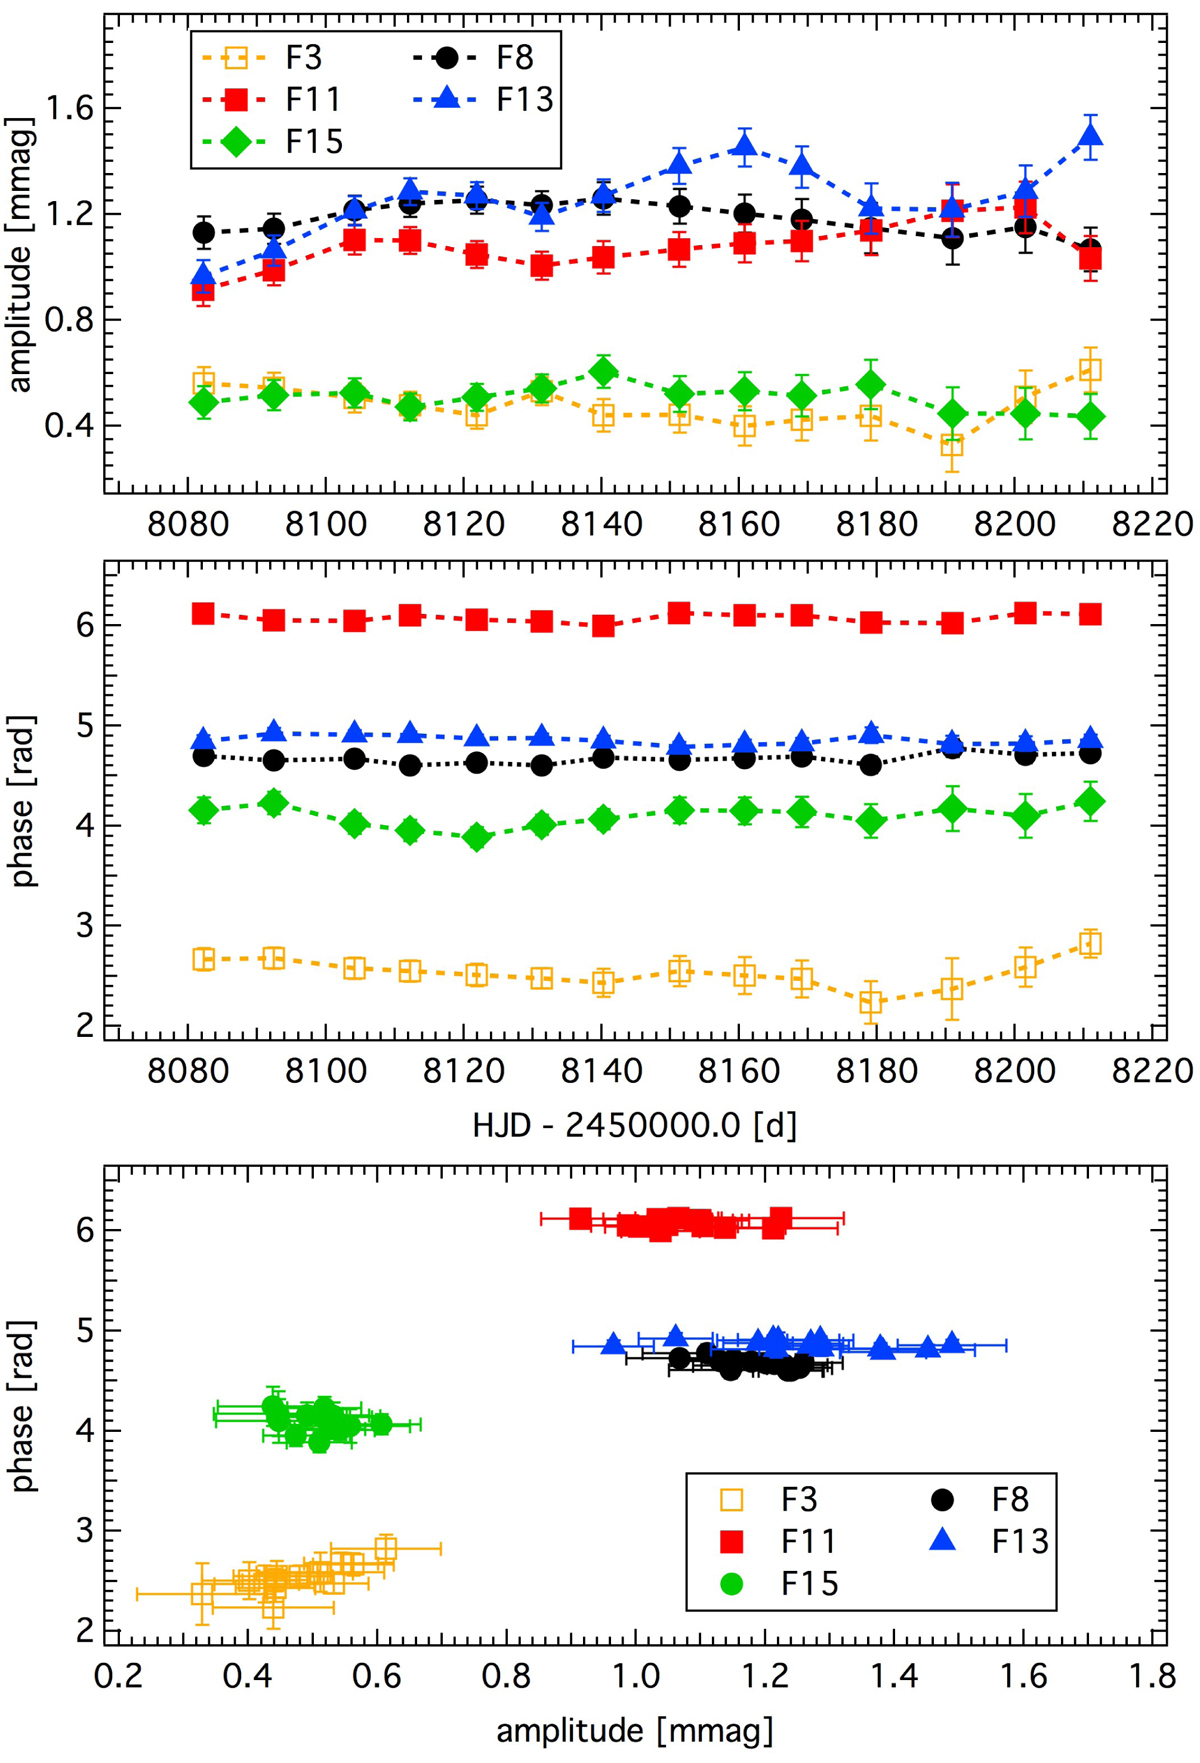
Amplitude (top panel) and phase (middle panel) behavior of the five pulsation frequencies with the highest amplitudes during the 2017/18 BHr observations calculated from 30-day subsets with 20-day overlaps, and amplitude-phase relation (bottom panel). The errors in phases are often smaller than the symbol size.
Current usage metrics show cumulative count of Article Views (full-text article views including HTML views, PDF and ePub downloads, according to the available data) and Abstracts Views on Vision4Press platform.
Data correspond to usage on the plateform after 2015. The current usage metrics is available 48-96 hours after online publication and is updated daily on week days.
Initial download of the metrics may take a while.