Fig. 7.
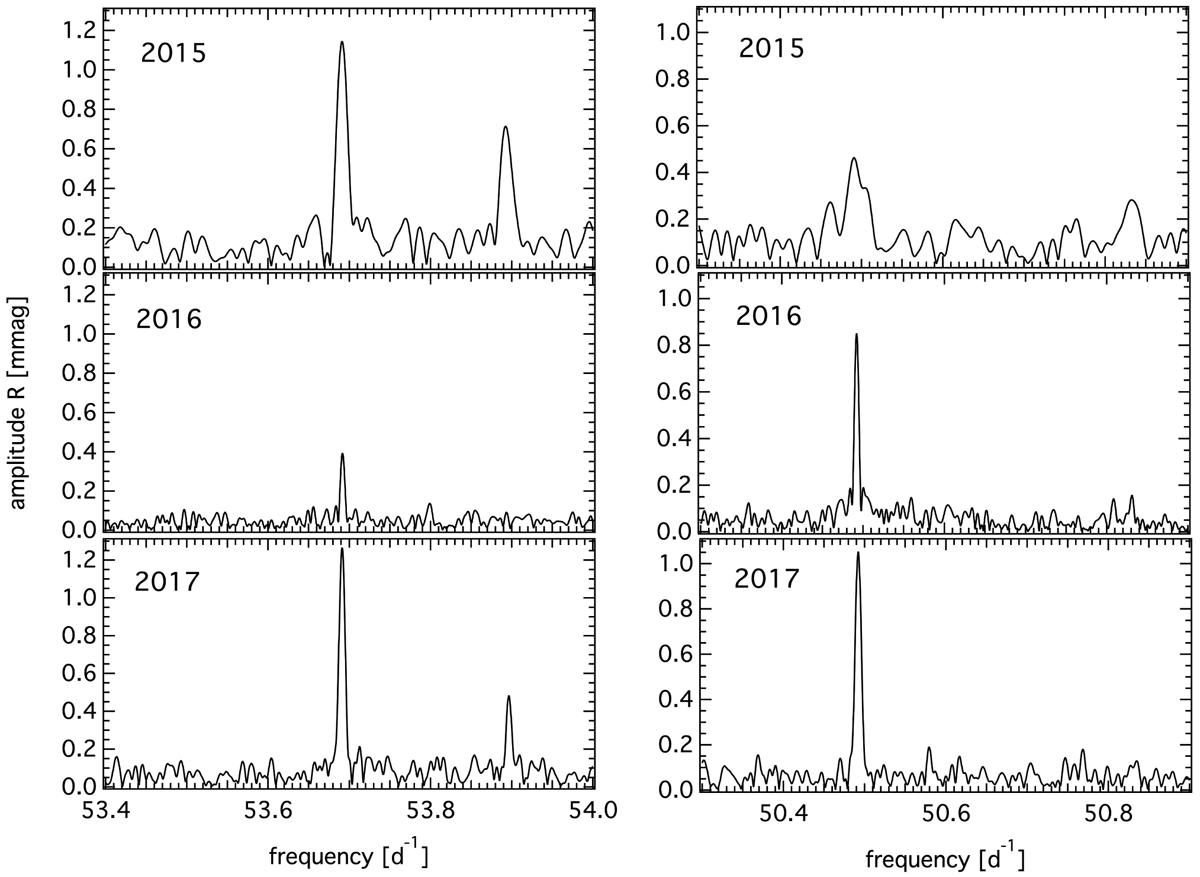
Zoom around F13 (left side, seen alongside with F14 in the 2015 data to the right of F13) and F11 (right side) into the original amplitude spectra of the BRITE red-filter data obtained in 2015 (top), 2016/2017 (middle), and 2017/2018 (bottom). The peak next to F13 in the bottom left panel showing the 2017/18 data is an alias frequency to F3 with the orbital frequency of BHr (i.e., 14.83053 d−1) that only appears quite close to the location of F14, which itself is not found in the 2017/18 data.
Current usage metrics show cumulative count of Article Views (full-text article views including HTML views, PDF and ePub downloads, according to the available data) and Abstracts Views on Vision4Press platform.
Data correspond to usage on the plateform after 2015. The current usage metrics is available 48-96 hours after online publication and is updated daily on week days.
Initial download of the metrics may take a while.