Fig. 3.
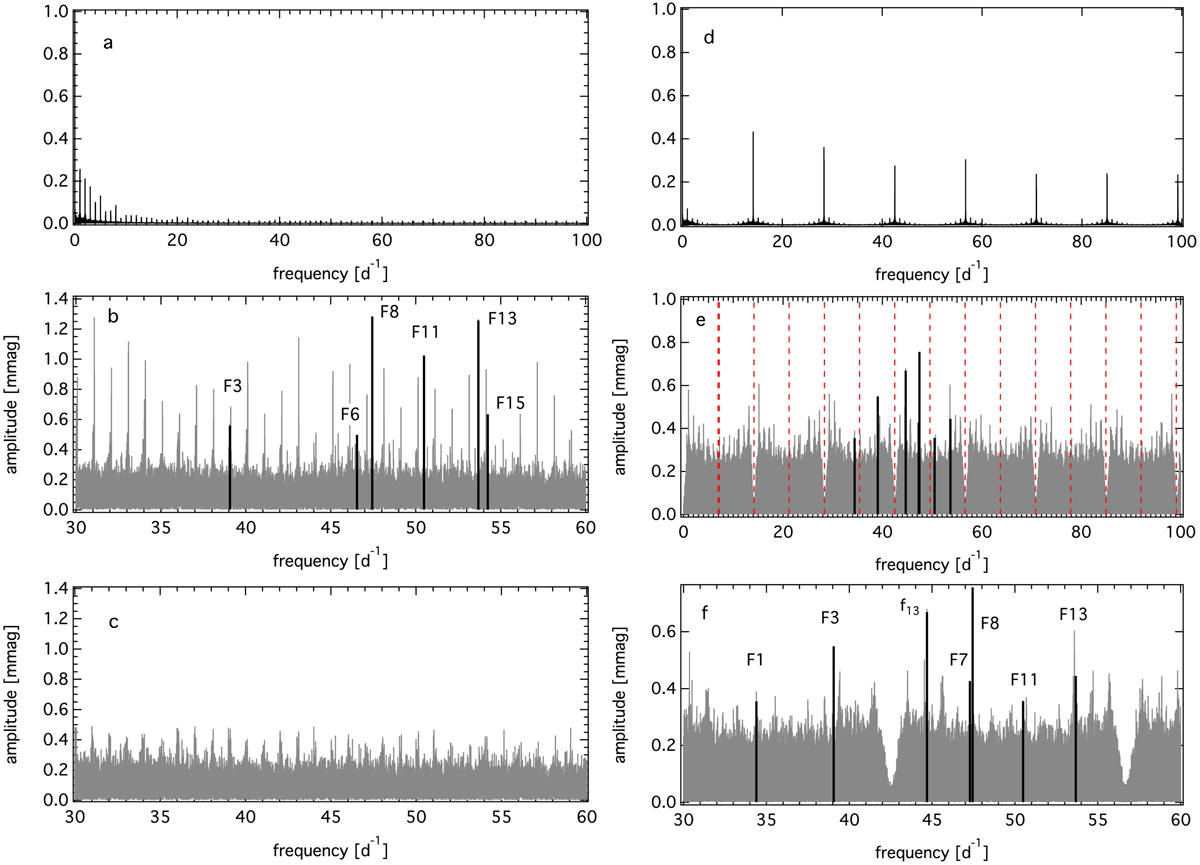
Frequency analysis using the bRing and SMEI photometric time series. Spectral windows (panels a and d), original amplitude spectrum from 30 to 60 d−1 (panel b) for bRing and from 0 to 100 d−1 (panel e) for SMEI, the residual bRing amplitude spectrum after subtraction of the six identified pulsation frequencies (panel c), and zoom into the frequency range from 30 to 60 d−1 for SMEI (panel f). The identified pulsation frequencies are marked as thick black lines and labeled according to their numbers in Table 3. Frequency f13 was identified in the SMEI data due to its presence in DM17, but it is not present in the BRITE data. The red dashed vertical lines mark the position of the Nyquist frequency for SMEI and its multiples. The occurrence of the orbital frequency of SMEI at 14.16 d−1 (i.e., twice fNyquist) and its multiples can be seen as the regular structure in the spectral window (panel d) and in the amplitude spectrum (panels e and f) as the points where the noise decreases steeply to very low levels.
Current usage metrics show cumulative count of Article Views (full-text article views including HTML views, PDF and ePub downloads, according to the available data) and Abstracts Views on Vision4Press platform.
Data correspond to usage on the plateform after 2015. The current usage metrics is available 48-96 hours after online publication and is updated daily on week days.
Initial download of the metrics may take a while.