Free Access
Fig. A.3.
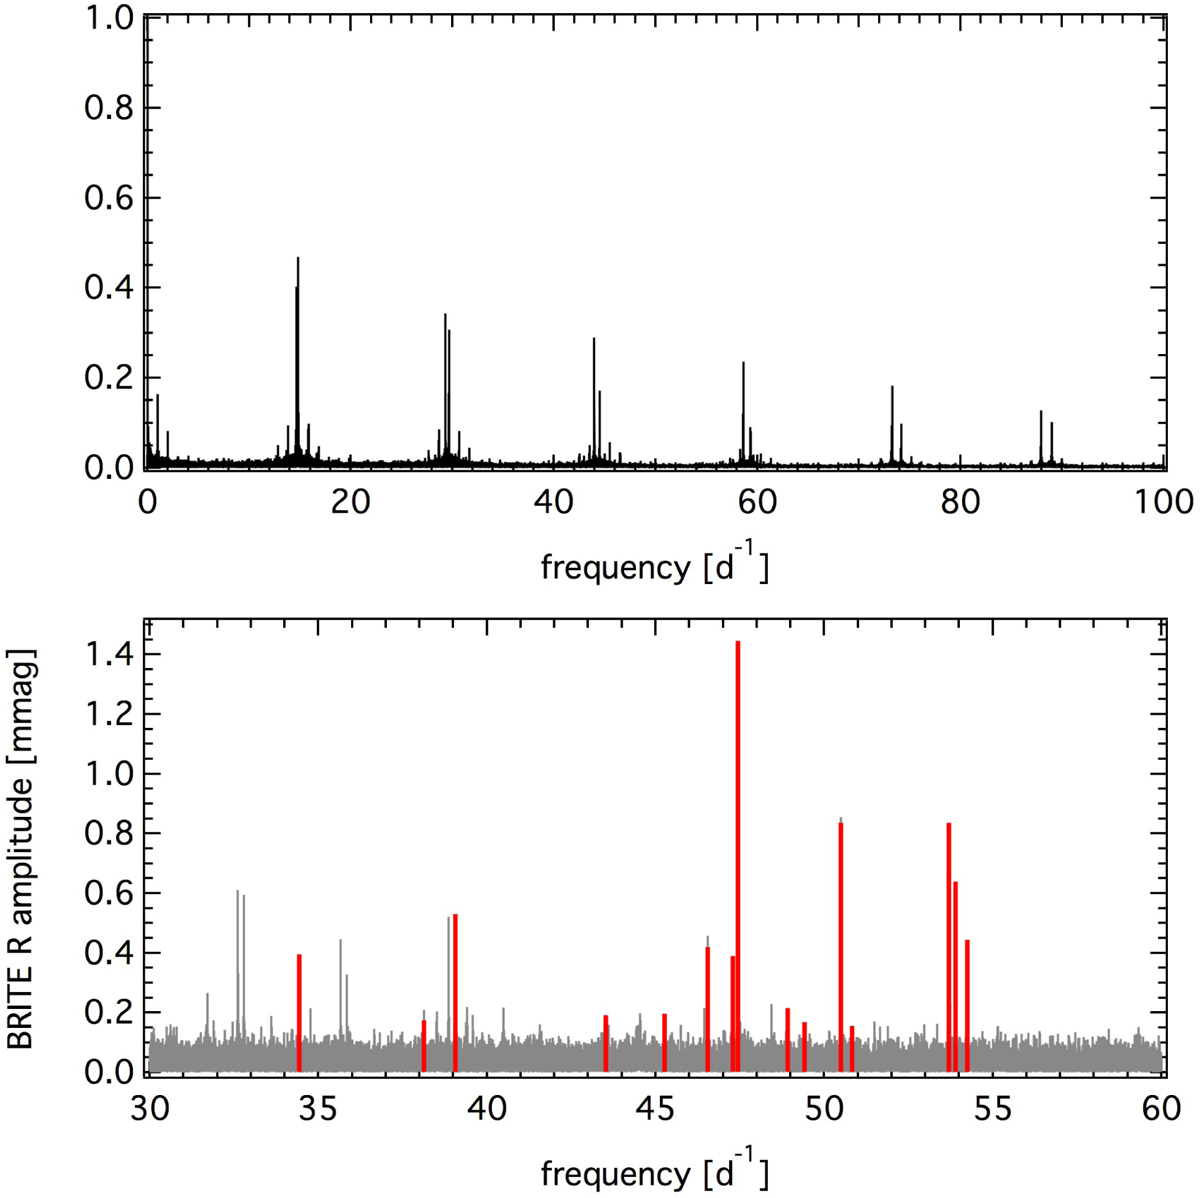
Frequency analysis of the combined BRITE R-filter data. Spectral window (top) and original amplitude spectrum from 30 to 60 d−1 (bottom) with the identified pulsation frequencies marked in red.
Current usage metrics show cumulative count of Article Views (full-text article views including HTML views, PDF and ePub downloads, according to the available data) and Abstracts Views on Vision4Press platform.
Data correspond to usage on the plateform after 2015. The current usage metrics is available 48-96 hours after online publication and is updated daily on week days.
Initial download of the metrics may take a while.