Fig. A.1.
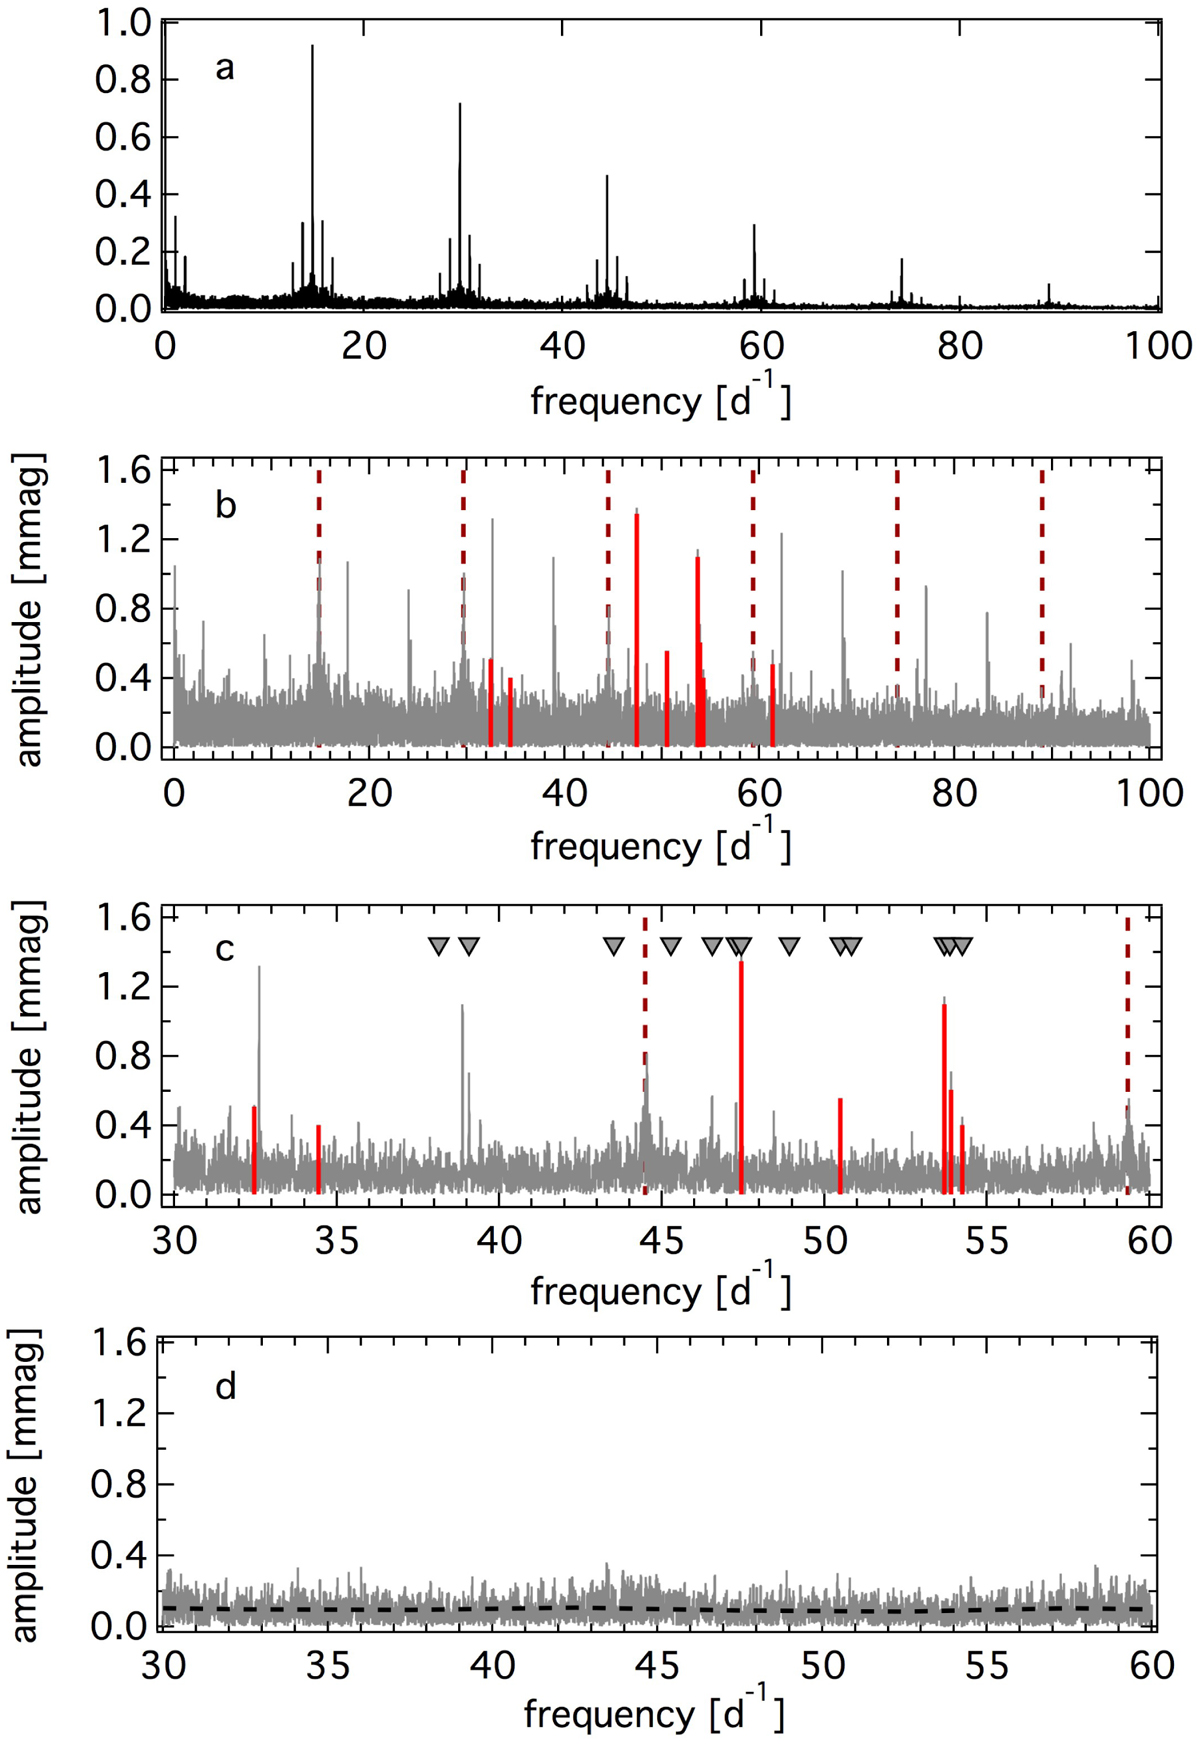
Frequency analysis of the BHr 2015 data. Spectral window (panel a), original amplitude spectrum from 0 to 100 d−1 (panel b), zoom into the original amplitude spectrum (panel c), and residual amplitude spectrum after prewhitening of the eight frequencies (panel d) with the residual noise level marked as horizontal dashed line. The triangles mark the frequencies found in the ASTEP data by Mékarnia et al. (2017). Vertical dashed lines mark the positions of the orbital frequencies of the BHr satellite and its multiples.
Current usage metrics show cumulative count of Article Views (full-text article views including HTML views, PDF and ePub downloads, according to the available data) and Abstracts Views on Vision4Press platform.
Data correspond to usage on the plateform after 2015. The current usage metrics is available 48-96 hours after online publication and is updated daily on week days.
Initial download of the metrics may take a while.