Fig. 13.
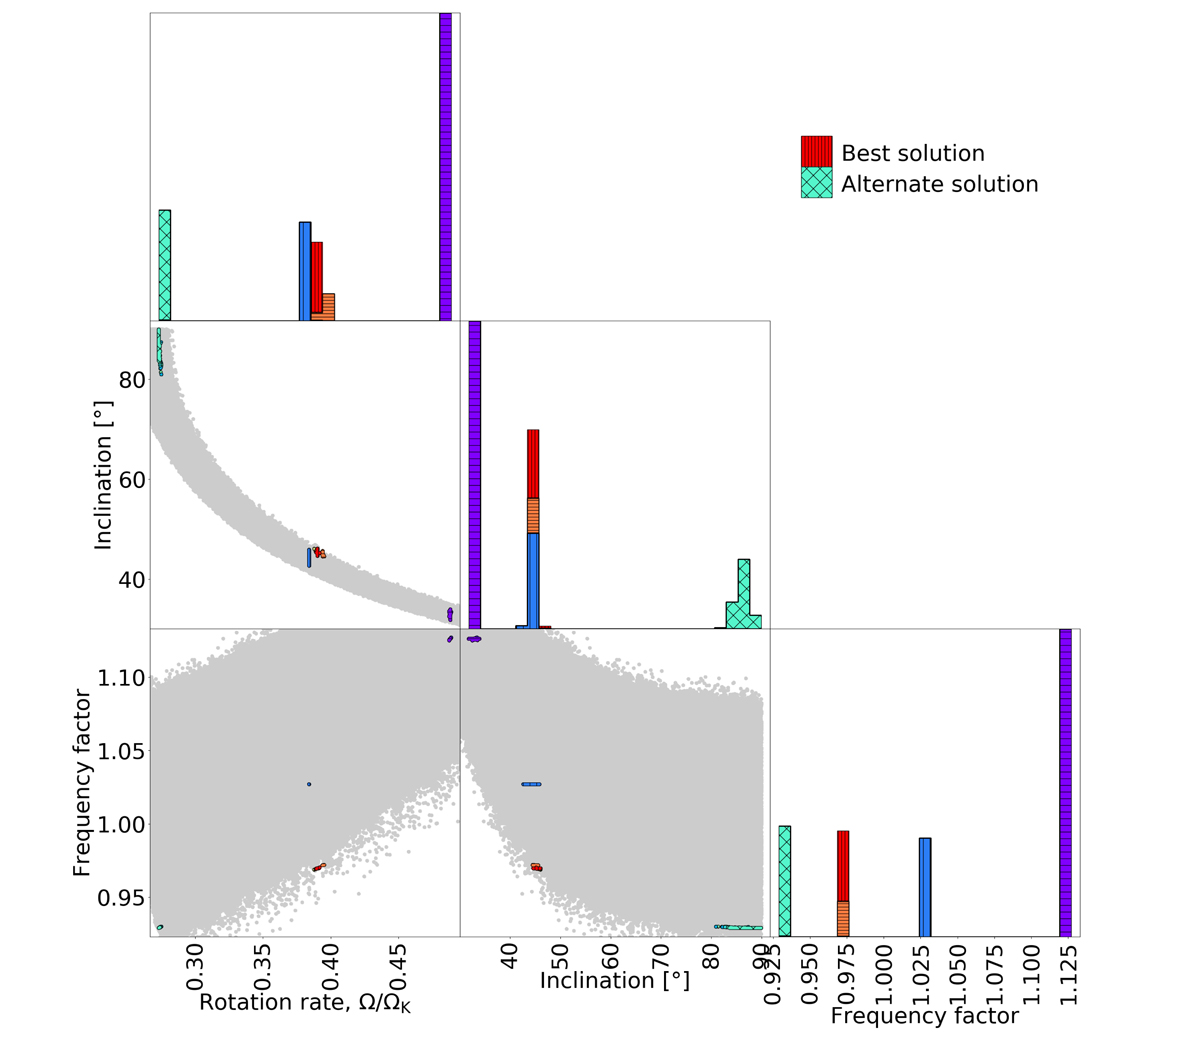
Distribution of solutions resulting from the seismic contraints (with the true observational errors), normalized amplitudes, and observed values of log g and v sin i. The plots along the diagonal are histograms for single variables, whereas the remaining plots are scatter plots for pairs of variables. The plots are color-coded according to the mode identification. The solutions shown in red have the same n, ℓ, m identification as the best solution.
Current usage metrics show cumulative count of Article Views (full-text article views including HTML views, PDF and ePub downloads, according to the available data) and Abstracts Views on Vision4Press platform.
Data correspond to usage on the plateform after 2015. The current usage metrics is available 48-96 hours after online publication and is updated daily on week days.
Initial download of the metrics may take a while.