Fig. 12.
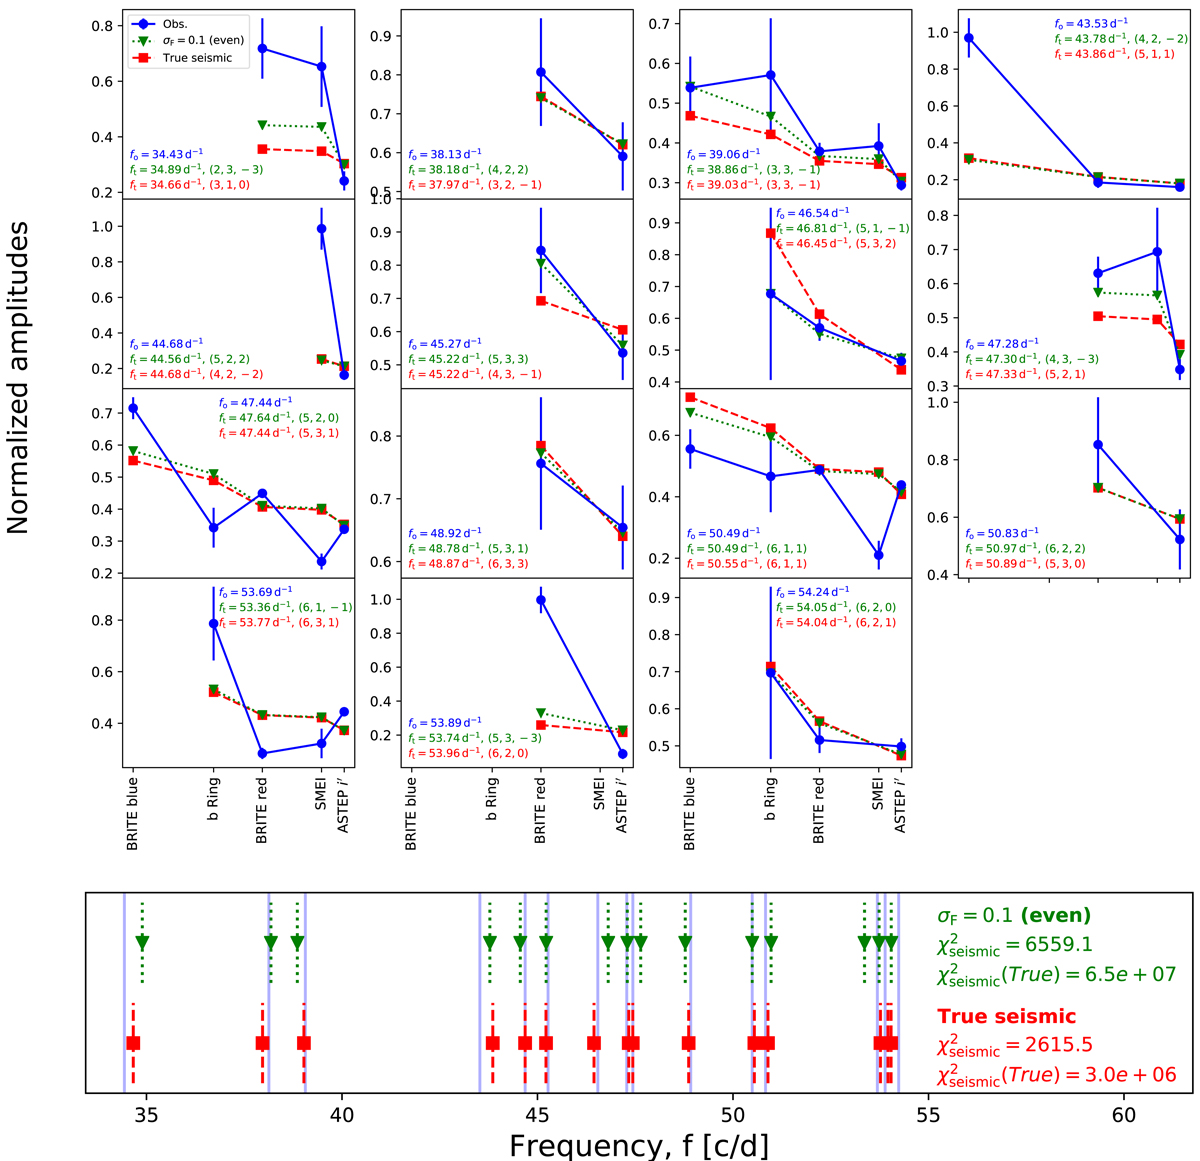
Upper panel: observed and best-fitting mode-normalized amplitudes in different photometric bands using the true errors and σF = 0.1 on the frequencies. In the latter case, only even modes are retained and the inclination search interval is [70 ° ,90 ° ] rather than [0 ° ,90 ° ]. The (n, ℓ, m) mode identifications are provided in each panel. Lower panel: observed vs. theoretical pulsation spectra for the two above cases. The observed frequencies are represented by the continuous vertical lines that span the plot. In both panels, the observations are shown in blue and the theoretical results and annotations are color-coded. χ2 calculations have 18 degrees of freedom, i.e., Ω/ΩK, i, f, and the 15 free amplitudes. In the upper panel, ![]() for the σF = 0.1 (even) case is 412.3, while
for the σF = 0.1 (even) case is 412.3, while ![]() for the true seismic case is 467.8.
for the true seismic case is 467.8.
Current usage metrics show cumulative count of Article Views (full-text article views including HTML views, PDF and ePub downloads, according to the available data) and Abstracts Views on Vision4Press platform.
Data correspond to usage on the plateform after 2015. The current usage metrics is available 48-96 hours after online publication and is updated daily on week days.
Initial download of the metrics may take a while.