Fig. 11.
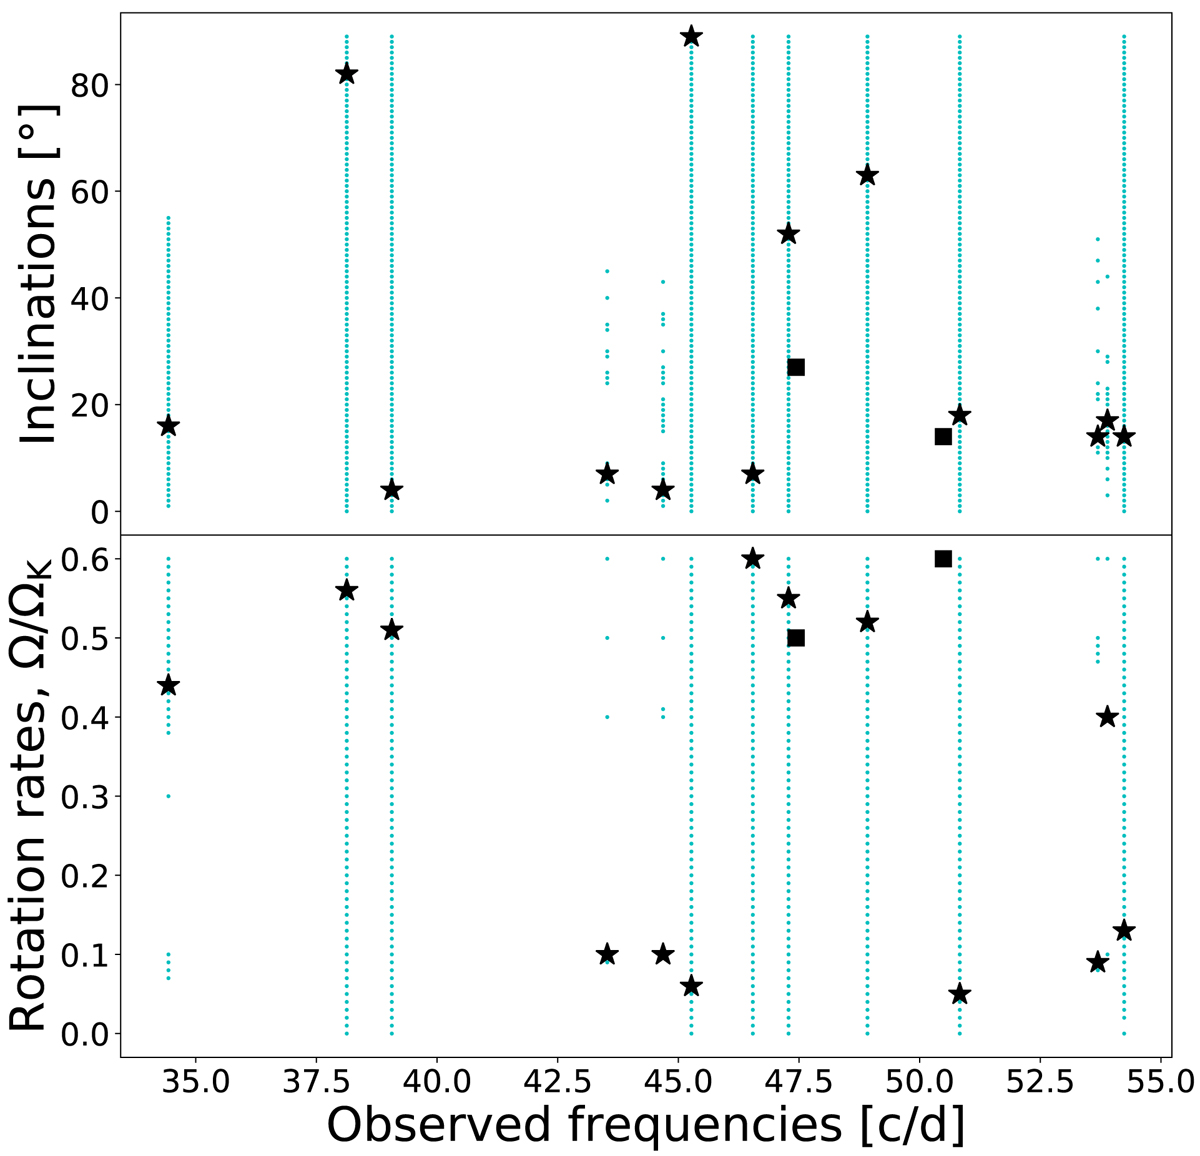
Inclinations (upper panel) and rotation rates (lower panel) obtained for each mode fit individually. The dark blue symbols represent the best solutions (i.e., those illustrated in Fig. 10). The small light blue dots are other solutions that satisfy the criterion χ2 ≤ (Nbands − 1), where χ2 is the χ2-value on the amplitudes for that particular mode and Nbands is the number of bands in which that mode is detected. The light blue solutions thus give an idea of the uncertainties on the above results.
Current usage metrics show cumulative count of Article Views (full-text article views including HTML views, PDF and ePub downloads, according to the available data) and Abstracts Views on Vision4Press platform.
Data correspond to usage on the plateform after 2015. The current usage metrics is available 48-96 hours after online publication and is updated daily on week days.
Initial download of the metrics may take a while.