Free Access
Fig. 10.
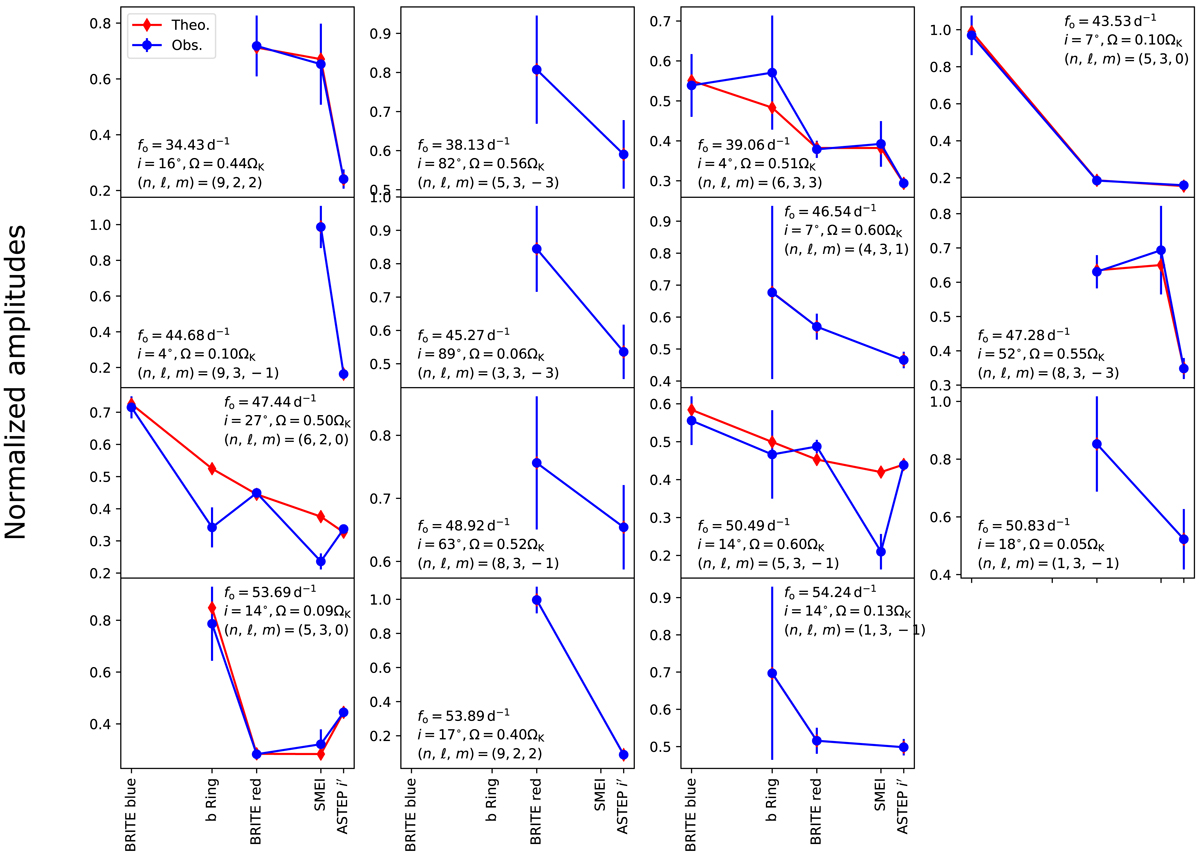
Observed (blue) and best-fitting theoretical (red) normalized amplitudes using individual fits. fo represents the observed frequencies. In several cases, the match between observed and theoretical normalized amplitudes is sufficiently good for the latter to be hidden in the plots. Finally, the total χ2 value is 68.9.
Current usage metrics show cumulative count of Article Views (full-text article views including HTML views, PDF and ePub downloads, according to the available data) and Abstracts Views on Vision4Press platform.
Data correspond to usage on the plateform after 2015. The current usage metrics is available 48-96 hours after online publication and is updated daily on week days.
Initial download of the metrics may take a while.