Fig. 1.
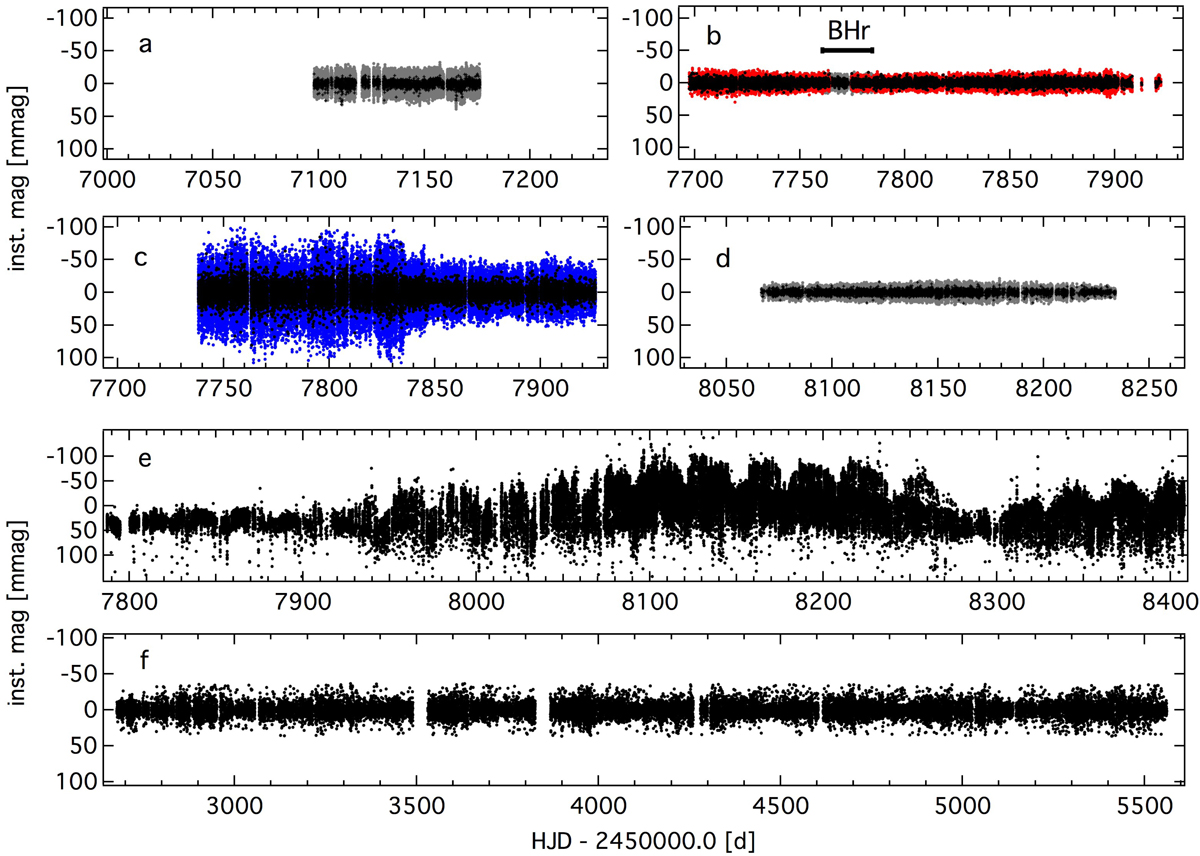
Final reduced light curves of β Pic from BRITE-Constellation, bRing and SMEI: BHr data 2015 (panel a, gray points), combined BTr (panel b, red points) and BHr (panel b, gray points) data 2016/17, BLb data 2016/17 (panel c, blue points), BHr data 2017/18 (panel d, gray points) where black dots show binning of the light curves in three-minute intervals; the bRing and SMEI time series are shown in panels e and f.
Current usage metrics show cumulative count of Article Views (full-text article views including HTML views, PDF and ePub downloads, according to the available data) and Abstracts Views on Vision4Press platform.
Data correspond to usage on the plateform after 2015. The current usage metrics is available 48-96 hours after online publication and is updated daily on week days.
Initial download of the metrics may take a while.