Fig. 3.
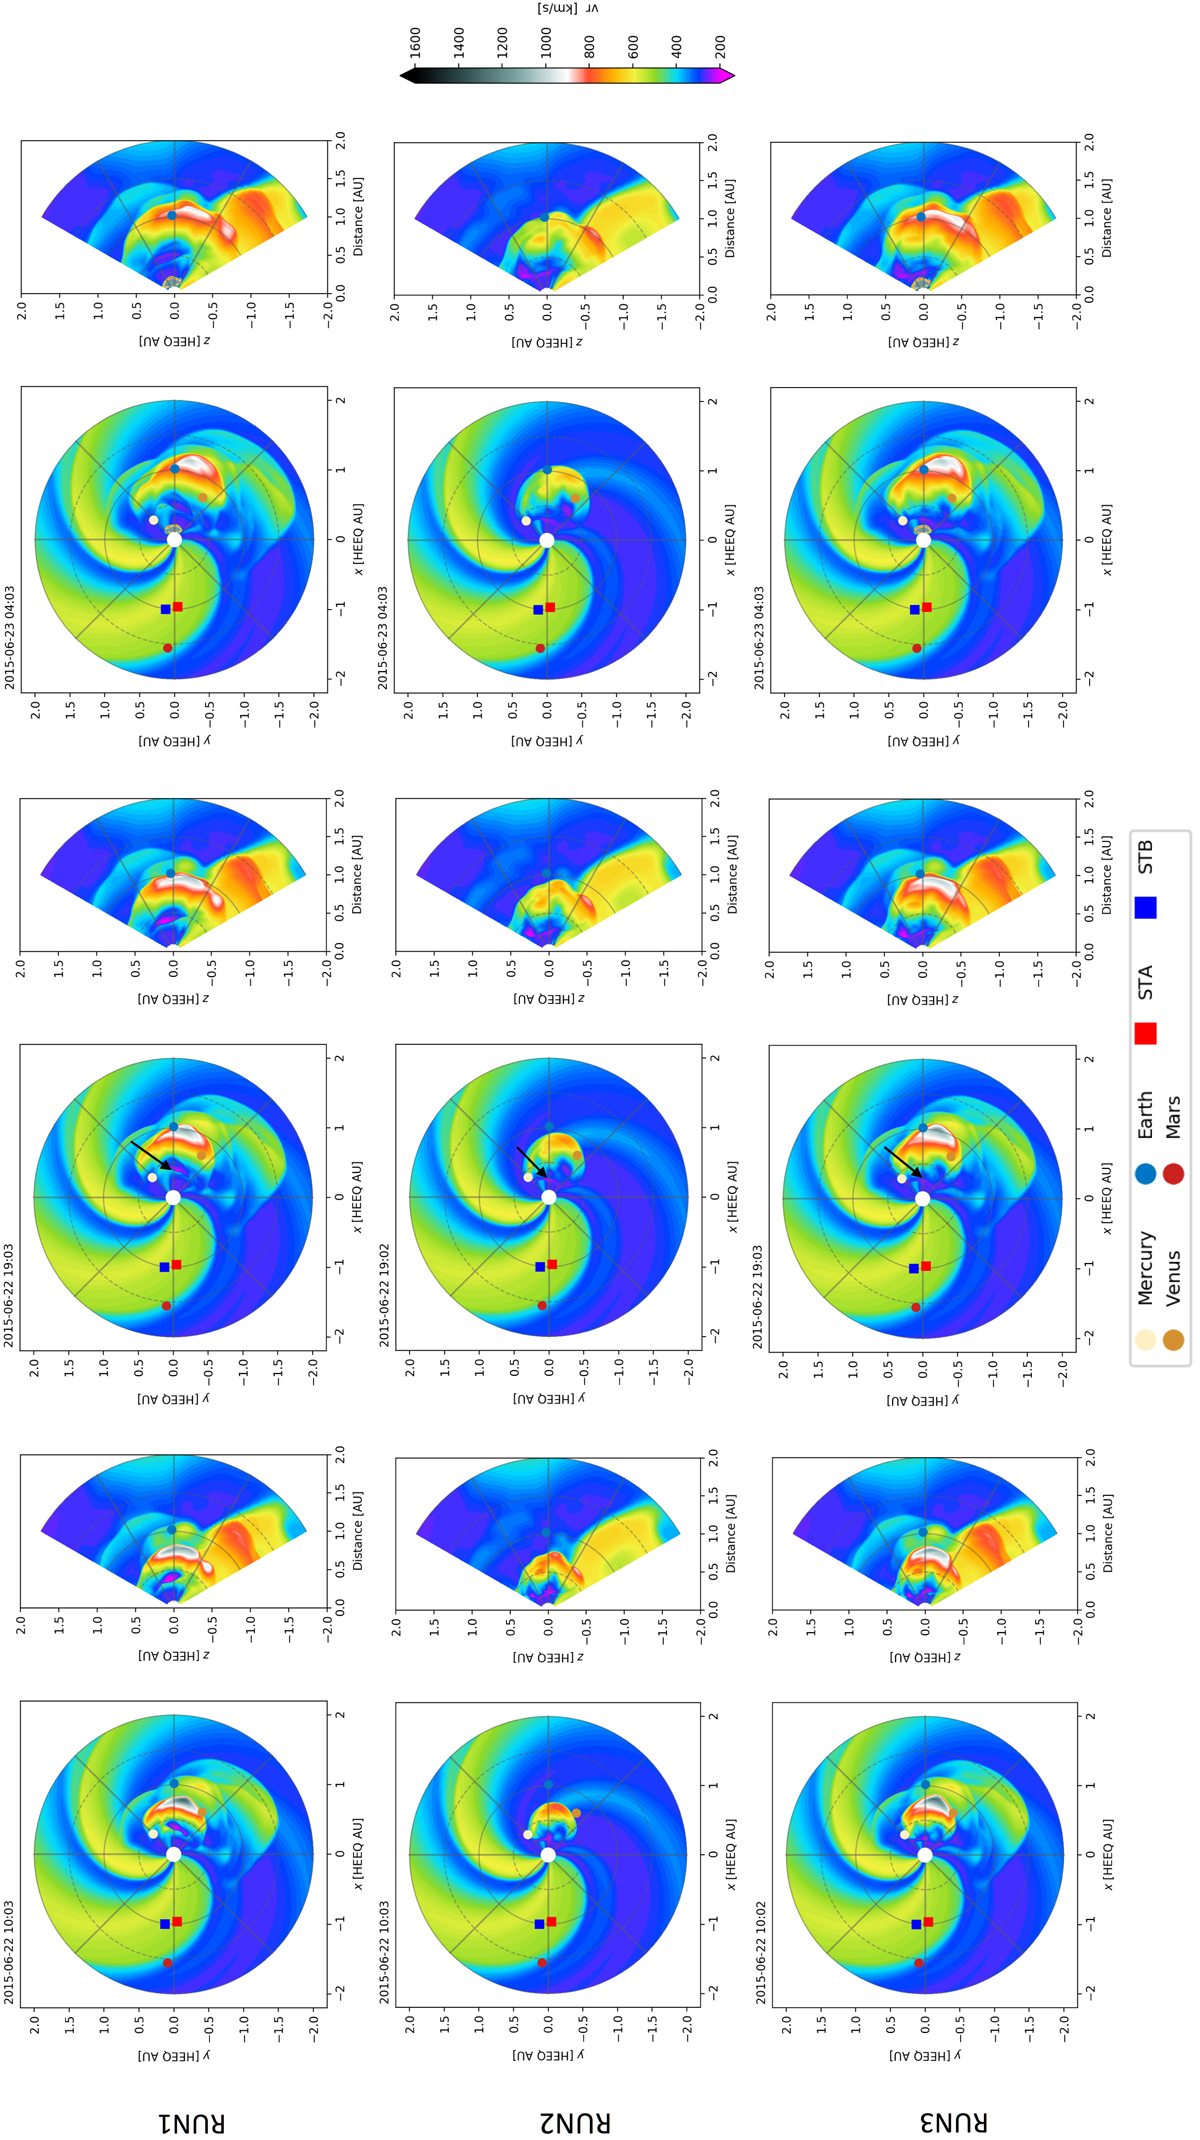
Snapshots from the simulation showing the radial speed νr [km s−1] on June 22, 2015 at 10:03 UT, 19:03 UT and June 23, 2015 at 04:03 UT. Left panels: solution in the heliographic equatorial plane, right panels: meridional plane that includes Earth. Top row: simulation run with five Cone model CMEs. Middle row: simulation run with one LFFS CME. Bottom row: simulation run with four Cone model CMEs and one LFFS CME. In the three middle panels, the black arrows indicate where the background solar wind is restored much farther out into the domain for the Cone model run, while for the LFFS runs this is not the case.
Current usage metrics show cumulative count of Article Views (full-text article views including HTML views, PDF and ePub downloads, according to the available data) and Abstracts Views on Vision4Press platform.
Data correspond to usage on the plateform after 2015. The current usage metrics is available 48-96 hours after online publication and is updated daily on week days.
Initial download of the metrics may take a while.