Fig. 7.
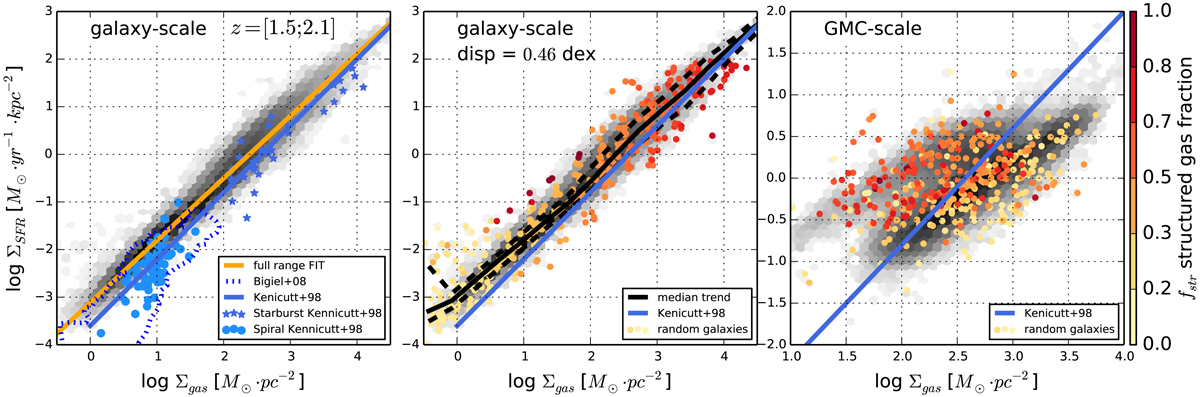
Schmidt–Kennicutt relations estimated from our model galaxies at both the galaxy scale and GMC scale. In the three panels the solid blue line indicates the Kennicutt (1998) relation. The grey shaded area is the distribution of a full sample of star-forming galaxies in the redshift range z = 1.5–2.1. Each coloured point indicates the position of an individual star-forming galaxy, uniformly selected within the galaxy-scale Σgas − ΣSFR plan. The colour bar indicates the fragmented gas fraction in each representative galaxy. Left panel: the solid orange line is the best fit computed for our entire sample of star-forming galaxies within this redshift range. The dashed contour indicates measurements of nearby galaxies (Bigiel et al. 2008). The blue stars and points are from the starburst and normal disk galaxy samples from Kennicutt (1998), respectively. Central panel: the solid black line indicates the median trend of our star-forming galaxy sample. The dashed black lines indicate the 15% and 85% percentiles ranges of our model galaxies. We estimate an average scatter in the distribution of 0.46 dex. Right panel: distribution of galaxies in the Σgas − ΣSFR estimated over the GMC-scale of star formation (see text for details). We show this estimate for the same galaxy sample used in the galaxy-scale Schmidt–Kennicutt relation in the two leftmost plots in this figure.
Current usage metrics show cumulative count of Article Views (full-text article views including HTML views, PDF and ePub downloads, according to the available data) and Abstracts Views on Vision4Press platform.
Data correspond to usage on the plateform after 2015. The current usage metrics is available 48-96 hours after online publication and is updated daily on week days.
Initial download of the metrics may take a while.