Fig. 5.
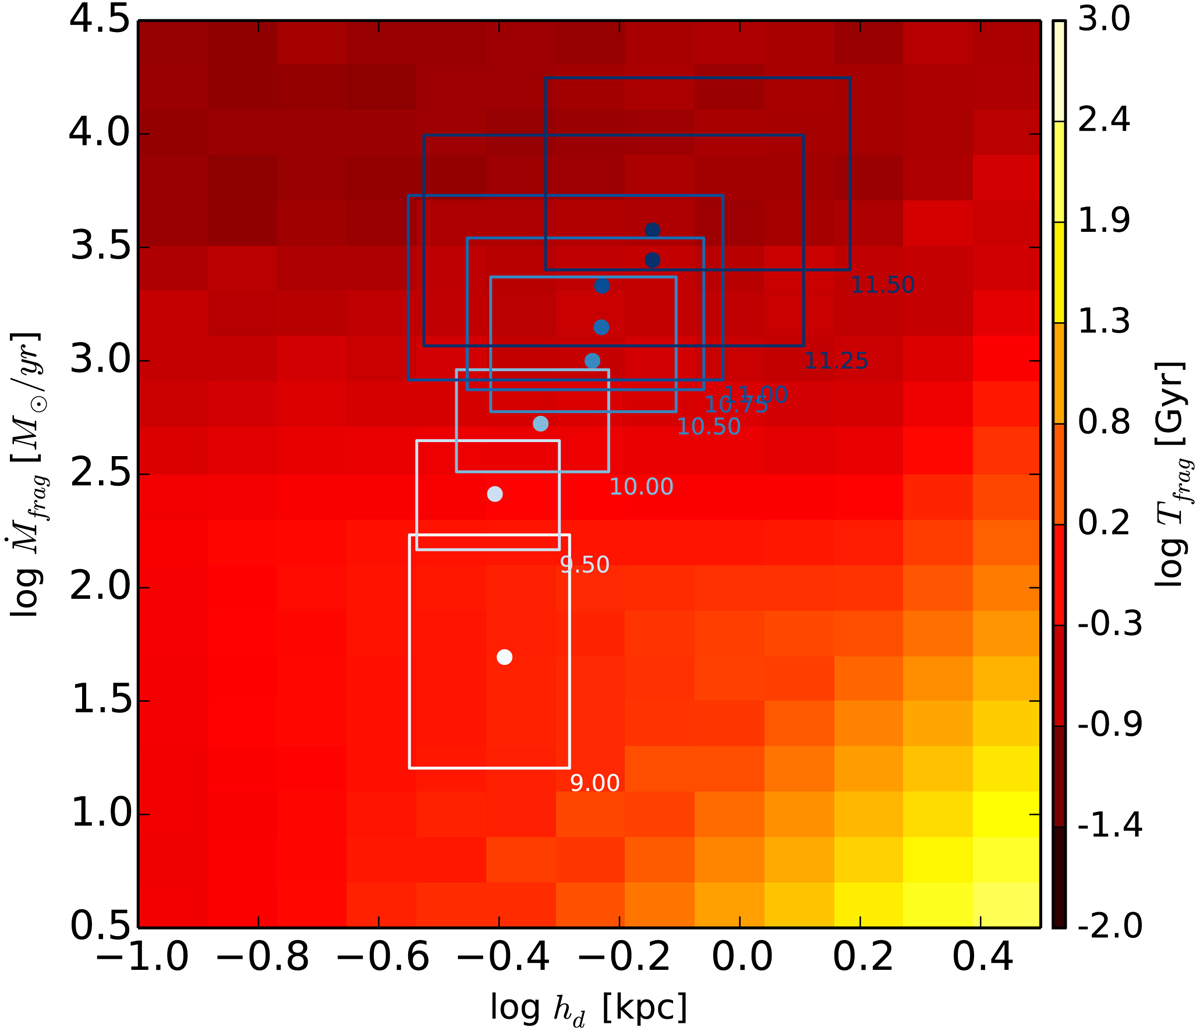
Gas fragmentation rate as a function of both the maximum energy injection scale, lmax, which we assume is equal to the disk scale-height, and the growth rate of GMCs (Eq. (14)). Each coloured box shown in the diagram represents the gas fragmentation rate for a specific stellar mass bin as indicated by the labels at the lower right corner of each box. The mass bins range from M⋆ = 109.0 M⊙ to 1011.5 M⊙. The limits of each box encompass the 15% and 85% percentiles of the distribution for each mass bin. Coloured points within each box indicate the value of the median of the distribution. The regions shown are for modelled galaxies at z = 2.1.
Current usage metrics show cumulative count of Article Views (full-text article views including HTML views, PDF and ePub downloads, according to the available data) and Abstracts Views on Vision4Press platform.
Data correspond to usage on the plateform after 2015. The current usage metrics is available 48-96 hours after online publication and is updated daily on week days.
Initial download of the metrics may take a while.