Fig. 15.
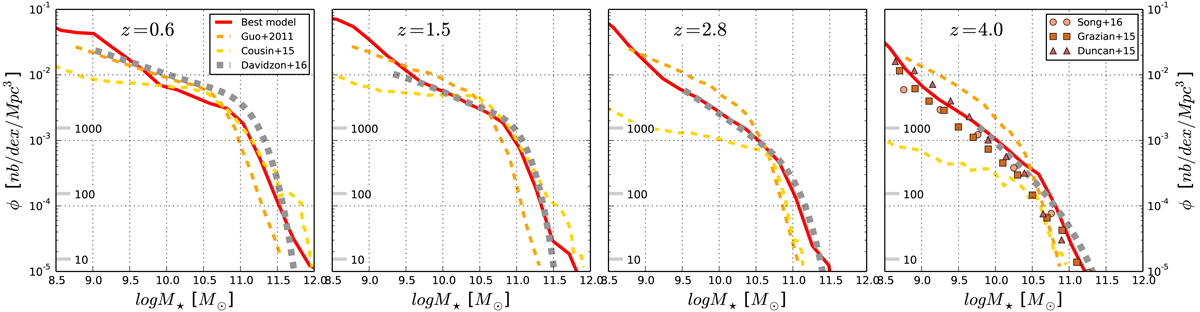
Comparison of the stellar mass functions predicted by our best fiducial model with those predicted by Guo et al. (2011). Each panel shows a different redshift as indicated at the upper left in each panel; solid red, dashed orange, and dashed gold lines indicate the predictions of G.A.S., Guo et al. (2011), and Cousin et al. 2019, A&A, 627, A132 (2015a), respectively (as indicated in the legend of the left-most panel). We compare these models with observations (dashed grey lines; Davidzon et al. 2016). At z = 4.0, we also plot additional observational measurements (salmon circles, red upward pointing triangles, and orange squares; Song et al. 2016; Duncan & Conselice 2015; Grazian et al. 2015, respectively, and as indicated in the legend of the right-most panel)
Current usage metrics show cumulative count of Article Views (full-text article views including HTML views, PDF and ePub downloads, according to the available data) and Abstracts Views on Vision4Press platform.
Data correspond to usage on the plateform after 2015. The current usage metrics is available 48-96 hours after online publication and is updated daily on week days.
Initial download of the metrics may take a while.