Fig. 14.
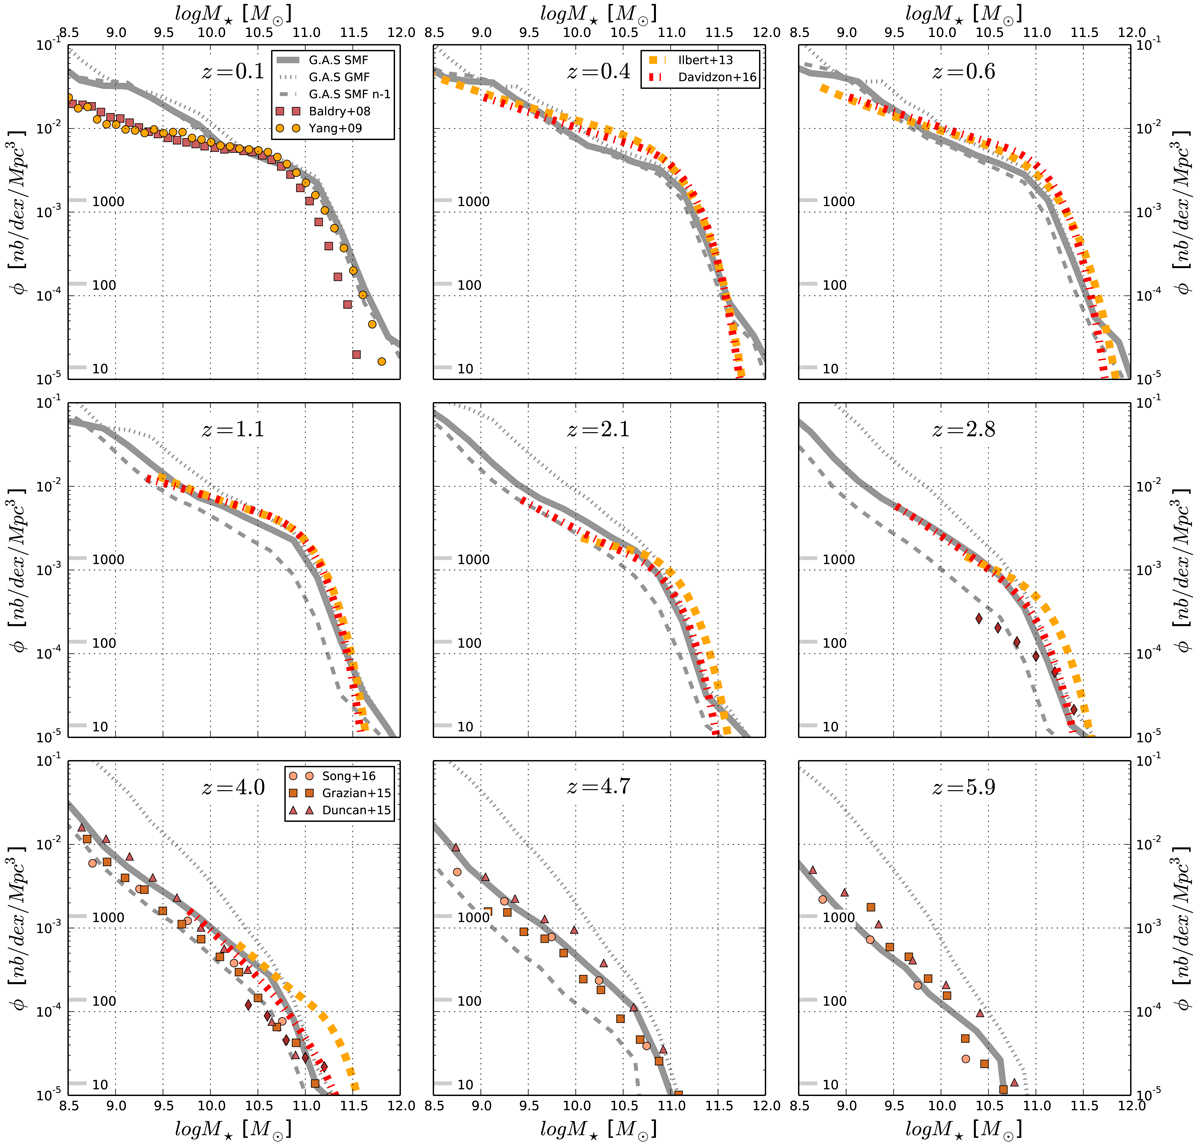
Comparison between the predictions of G.A.S. with observational estimates of the co-moving number density of galaxies for 9 redshift bins spanning the range, z ≃ 0.1–z ≃ 6 (from upper left to lower right and as indicated at the top of each panel). We compare the predictions of the G.A.S. model (solid grey lines) with various studies: Baldry et al. (2008, red squares), Yang et al. (2009, orange circles), Caputi et al. (2011, brown diamonds), Grazian et al. (2015, chocolate squares), Duncan & Conselice (2015, chestnut-red triangles), Song et al. (2016, salmon circles), Ilbert et al. (2013, yellow dashed-line), and Davidzon et al. (2016, red dot-dashed line). For this comparison with observations, we indicate binned measurements using points and best-fit stellar mass functions as dashed lines (Schechter and double-Schechter). All stellar mass functions are for a Chabrier IMF. The best fits of Ilbert et al. (2013) and Davidzon et al. (2016) are corrected for the Eddington bias which affects the high-mass galaxy bins in particular. The grey dotted-line indicates the total gas plus stars, baryonic mass function predicted by G.A.S.The grey dashed-line indicates the stellar mass function of the previous panel for the next highest redshift bin. The tick marks placed on the left side of each panel indicate the number of galaxies used in the stellar mass function predicted by the G.A.S. model.
Current usage metrics show cumulative count of Article Views (full-text article views including HTML views, PDF and ePub downloads, according to the available data) and Abstracts Views on Vision4Press platform.
Data correspond to usage on the plateform after 2015. The current usage metrics is available 48-96 hours after online publication and is updated daily on week days.
Initial download of the metrics may take a while.