Open Access
Fig. 13.
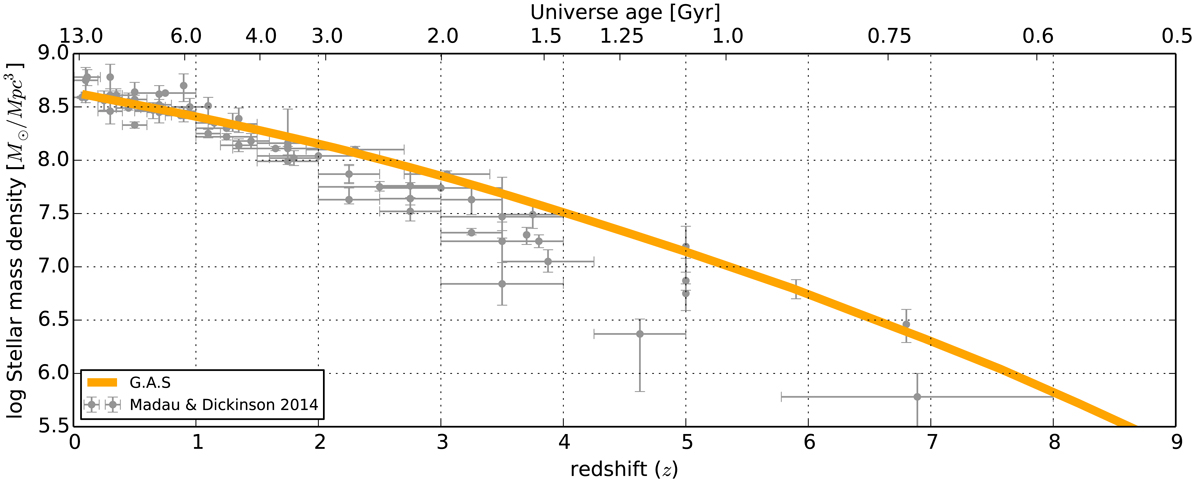
Redshift evolution of the co-moving stellar mass volume density. The solid orange line is the prediction of the G.A.S. model. We compare our predictions with the compilation of observational results (see Madau & Dickinson 2014, and references therein).
Current usage metrics show cumulative count of Article Views (full-text article views including HTML views, PDF and ePub downloads, according to the available data) and Abstracts Views on Vision4Press platform.
Data correspond to usage on the plateform after 2015. The current usage metrics is available 48-96 hours after online publication and is updated daily on week days.
Initial download of the metrics may take a while.