Fig. 10.
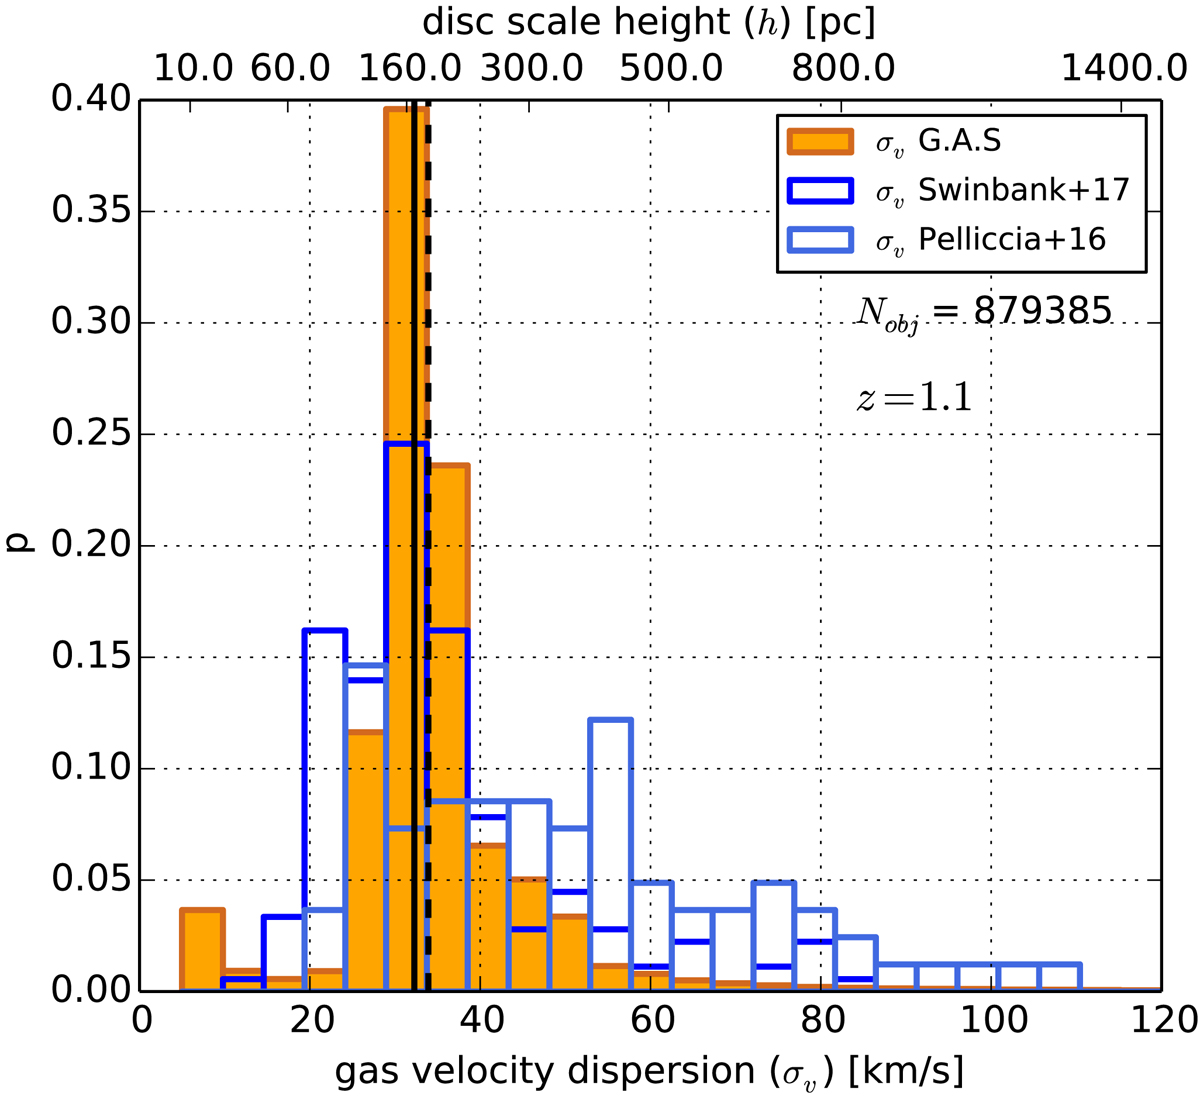
Probability distribution of the velocity dispersion of the diffuse gas. This distribution represents model galaxies with M⋆ > 107 M⊙ and at z = 1.1. We compare this distribution with observational measurements from Swinbank et al. (2017, dark blue histrogram) and Pelliccia et al. (2017, light blue histrogram). The solid and dashed vertical lines represent the median and mean value of the distribution of our modelled galaxies, respectively.
Current usage metrics show cumulative count of Article Views (full-text article views including HTML views, PDF and ePub downloads, according to the available data) and Abstracts Views on Vision4Press platform.
Data correspond to usage on the plateform after 2015. The current usage metrics is available 48-96 hours after online publication and is updated daily on week days.
Initial download of the metrics may take a while.