Fig. 1.
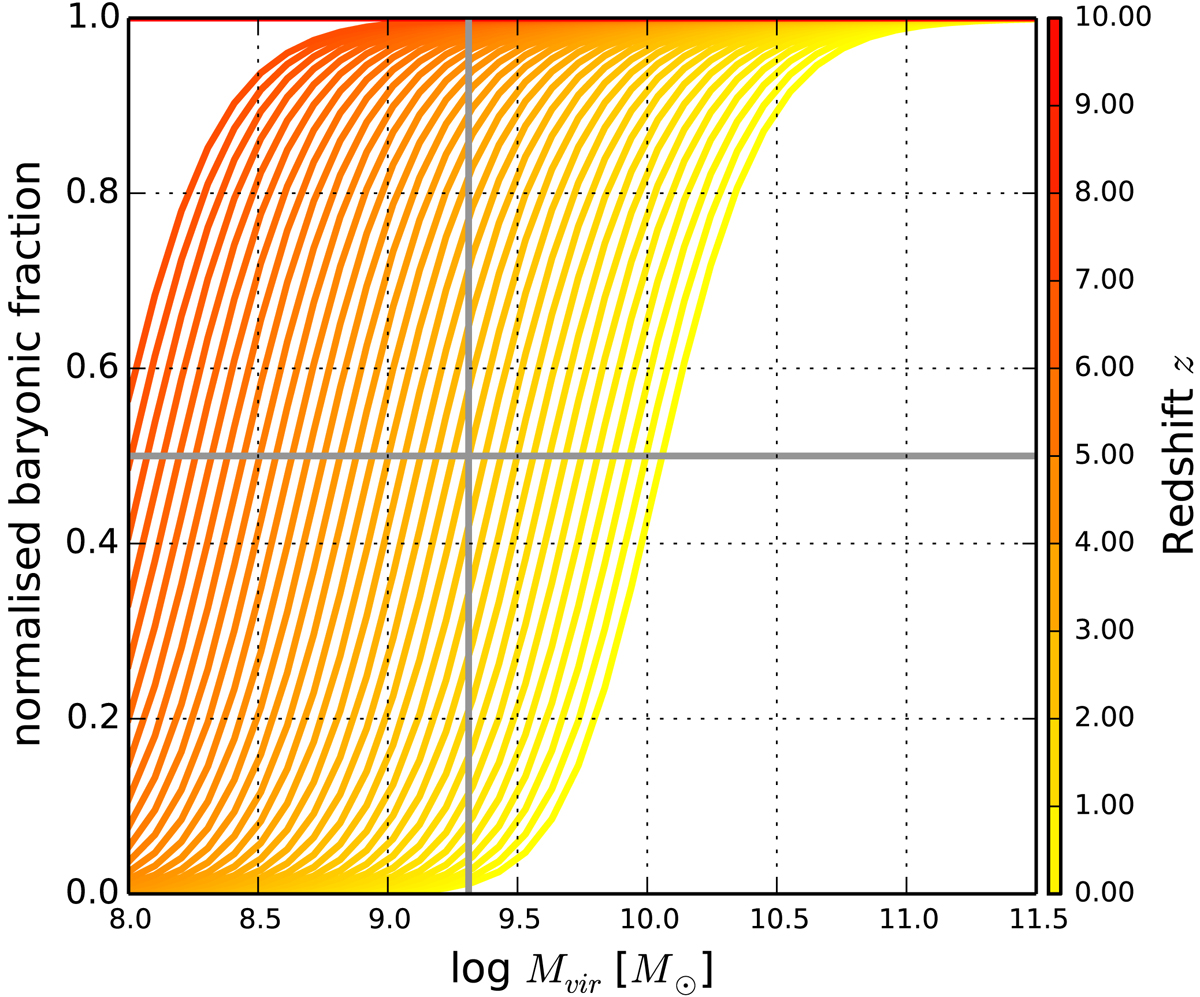
Relative mass fraction of baryons which are accreted smoothly. The fraction is plotted as a function of both the dark-matter virial mass and redshift. The redshift of each curve is colour coded by the colour bar on the right. Each curve, starting at z = 0.0, is separated by Δz = 0.1. For z > zreion = 7.0, we set ![]() . The grey vertical bar indicates the minimum halo mass in our dark-matter model. The grey horizontal line indicates f = 0.5.
. The grey vertical bar indicates the minimum halo mass in our dark-matter model. The grey horizontal line indicates f = 0.5.
Current usage metrics show cumulative count of Article Views (full-text article views including HTML views, PDF and ePub downloads, according to the available data) and Abstracts Views on Vision4Press platform.
Data correspond to usage on the plateform after 2015. The current usage metrics is available 48-96 hours after online publication and is updated daily on week days.
Initial download of the metrics may take a while.