Fig. 6.
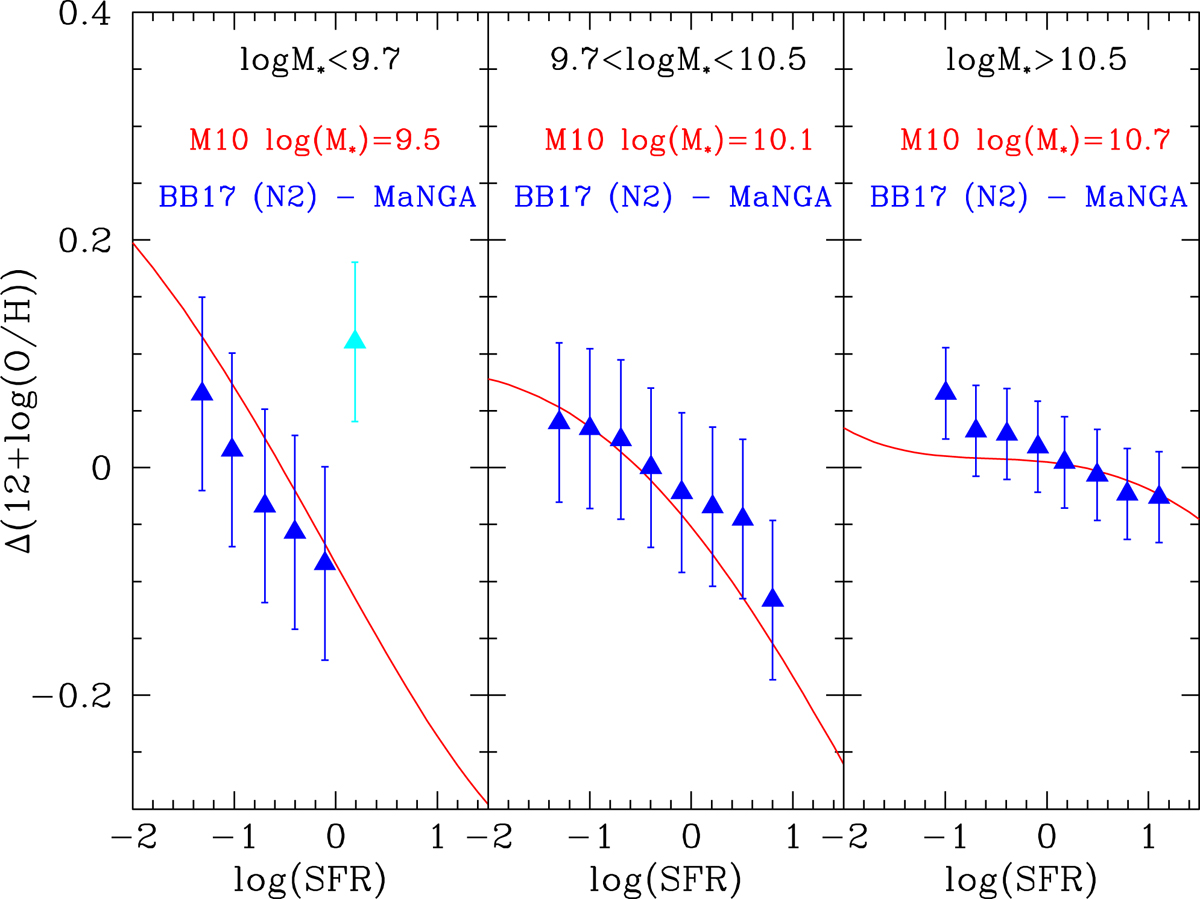
MZ residuals for the MaNGA galaxies in BB17 using the N2 calibration against their SFR in three mass bins, shown as blue triangles, derived from Fig. 5 of BB17. The cyan point indicates the highest SFR bin at low mass, where the fraction of galaxies in BB17 is low and the scatter among different calibrators is much higher (see discussion in BB17). The red lines show the expectations of the FMR, directly for Eq. (4) of M10. The error bars represent the dispersion of the residuals in each bin (see BB17). Contrary to what was affirmed by BB17, MaNGA galaxies closely follow the prediction of the FMR in M10 in all mass bins.
Current usage metrics show cumulative count of Article Views (full-text article views including HTML views, PDF and ePub downloads, according to the available data) and Abstracts Views on Vision4Press platform.
Data correspond to usage on the plateform after 2015. The current usage metrics is available 48-96 hours after online publication and is updated daily on week days.
Initial download of the metrics may take a while.