Fig. 4.
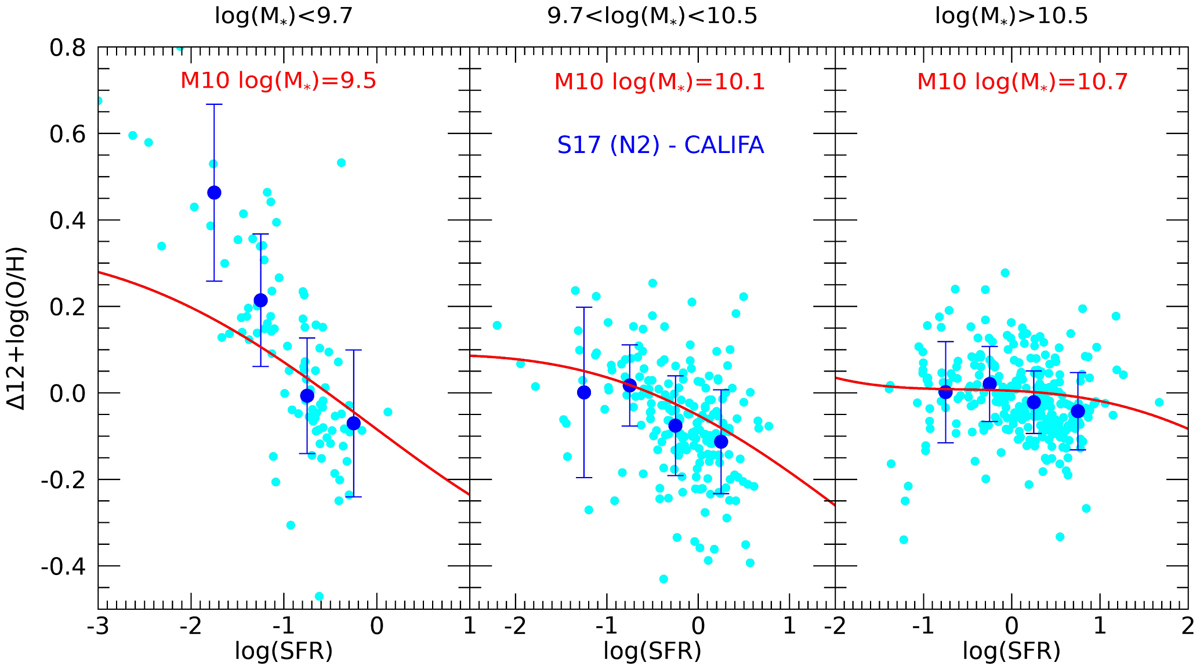
MZ residuals for the CALIFA galaxies in S17, rescaled to the Maiolino et al. (2008) N2 calibration, plotted against their SFR in three mass bins. The cyan circles show single galaxies, while the blue points indicate the median in SFR bins with their 1σ dispersion. The red lines indicate the expectations of the FMR for a representative M* in each bin from M10. Clearly a strong dependency of SFR is present at low mass, decreasing in the higher mass bins, in agreement with the predictions of the FMR.
Current usage metrics show cumulative count of Article Views (full-text article views including HTML views, PDF and ePub downloads, according to the available data) and Abstracts Views on Vision4Press platform.
Data correspond to usage on the plateform after 2015. The current usage metrics is available 48-96 hours after online publication and is updated daily on week days.
Initial download of the metrics may take a while.