Fig. 3.
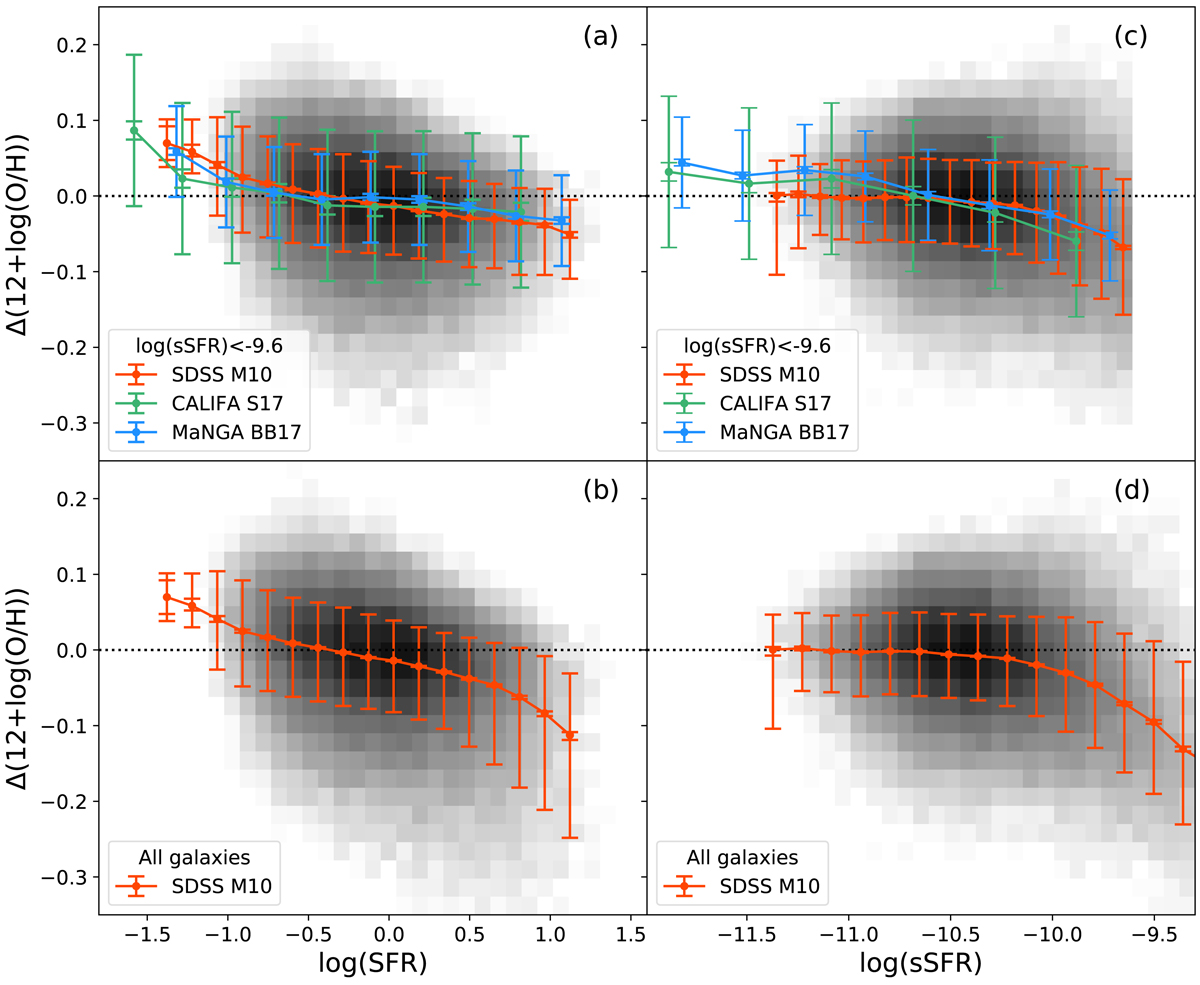
Difference between the measured metallicity of the SDSS M10 sample artificially cut at log(sSFR) <−9.6, to match the S17 and BB17 samples, and the median MZ relation as a function of the SFR (panel a), and as a function of sSFR (panel c). The medians in each SFR and sSFR bin are shown as red points. It can be seen how the expected behaviour for the M10 sample is basically a flat curve, with a mild signal at the lowest log(SFR) < −1.2, where higher metallicities Δ(log(O/H)) < 0.1 dex are expected. The same relation as derived for CALIFA galaxies by S17 is overplotted with green points, while the data from MaNGA galaxies derived by BB17 are overplotted as blue points. The error bars shown are the mean standard deviation along the considered bins for MaNGA and CALIFA, as reported by B17 and S17, while they show 1σ dispersion in each bin for SDSS. For comparison, we also plot the standard errors on the mean for the three samples. In panels b and d the same plots are reported but for the full SDSS M10 sample, without a sSFR cut. In this case, metallicities lower by Δ(log(O/H)) < 0.1 dex are found at the highest log(SFR) > 0.8. All panels clearly demonstrate that most of the dependency of the MZR residuals on SFR is hidden when the sample is not split into mass bins.
Current usage metrics show cumulative count of Article Views (full-text article views including HTML views, PDF and ePub downloads, according to the available data) and Abstracts Views on Vision4Press platform.
Data correspond to usage on the plateform after 2015. The current usage metrics is available 48-96 hours after online publication and is updated daily on week days.
Initial download of the metrics may take a while.