Open Access
Fig. 9.
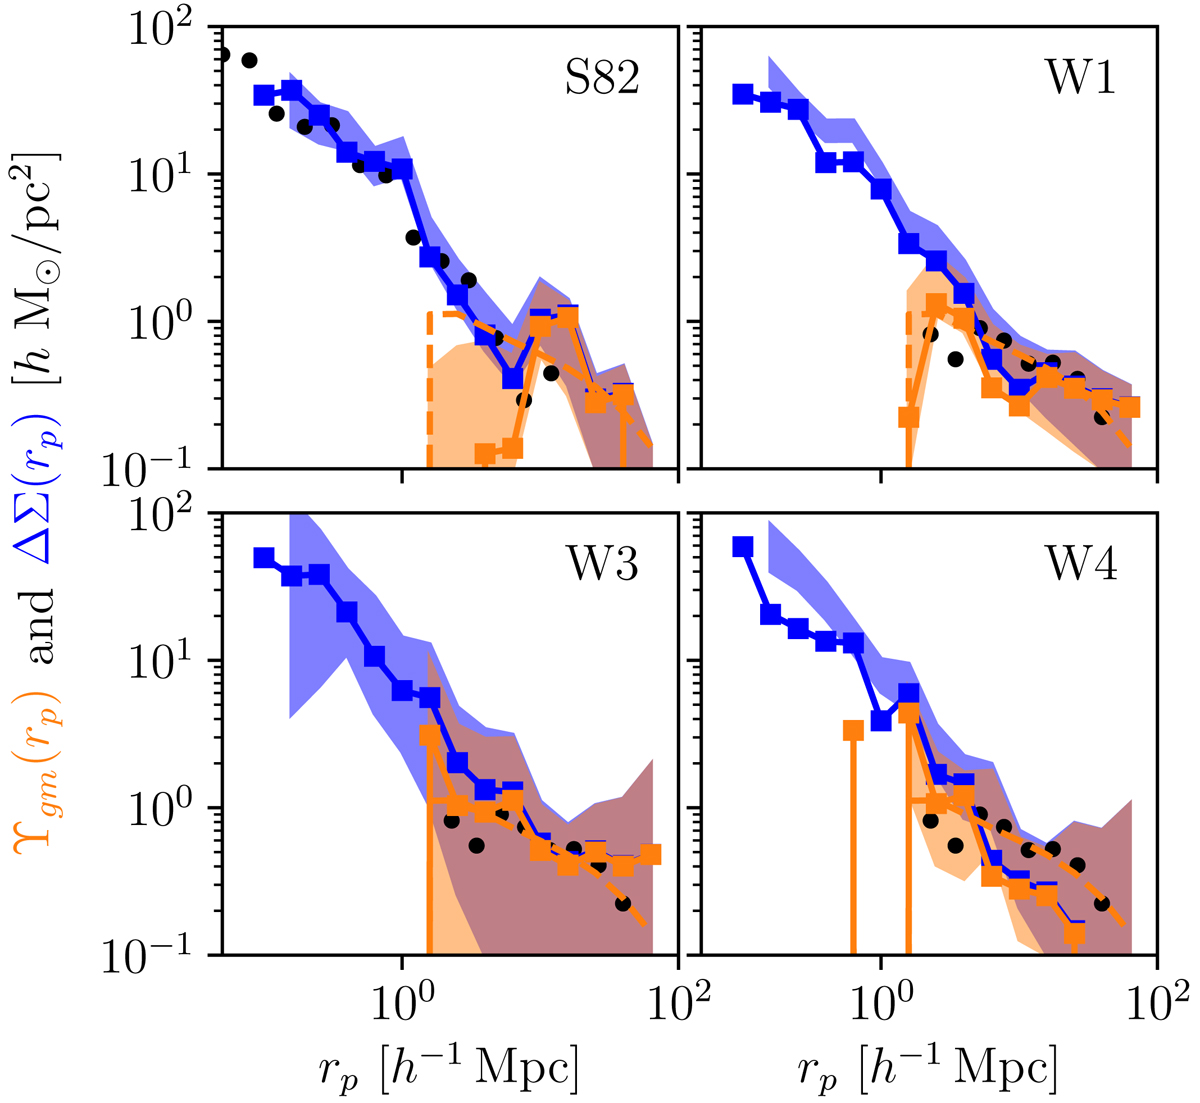
Filtered Υgm and non-filtered ΔΣ GGL measurements with mocks (shaded regions), ΔΣ and Υ data (blue and orange points respectively), and theory with a linear bias parameter b1 = 1.8 (dashed line). Black dots in S82 panel represent ΔΣ measurements from L16, and Υgm measurements from Alam et al. (2017) in CFHTLS panels.
Current usage metrics show cumulative count of Article Views (full-text article views including HTML views, PDF and ePub downloads, according to the available data) and Abstracts Views on Vision4Press platform.
Data correspond to usage on the plateform after 2015. The current usage metrics is available 48-96 hours after online publication and is updated daily on week days.
Initial download of the metrics may take a while.