Open Access
Fig. 8.
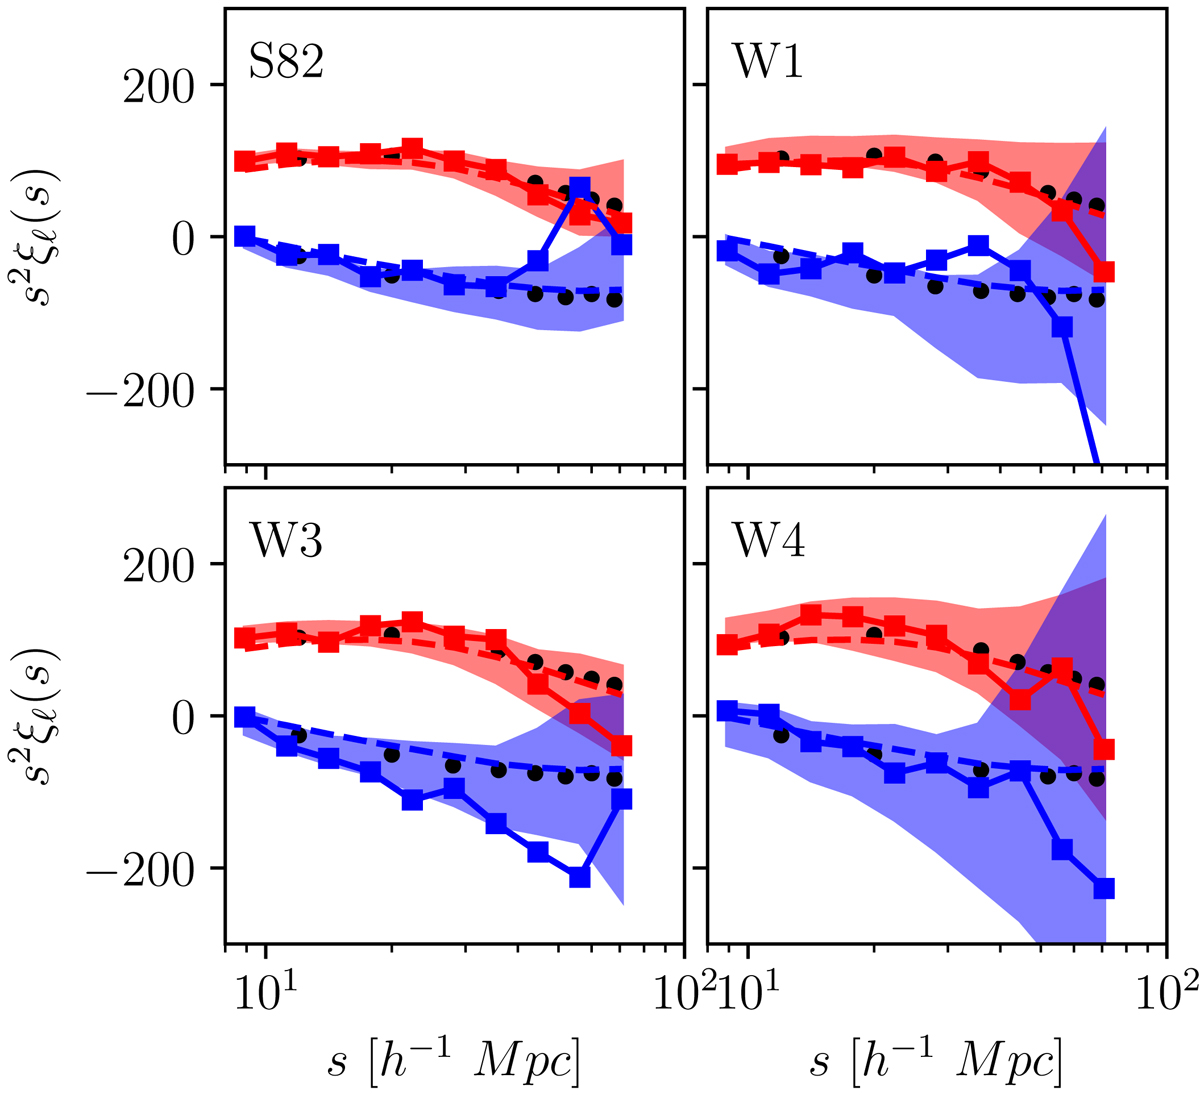
Monopole (red) and quadrupole (blue) measurements with mock catalogues (shaded region), real data (solid lines), and theoretical predictions with a linear bias parameter b1 = 1.8 (dashed lines). Black dots represent pre-reconstruction measurements with the full DR12v5 CMASS sample from Cuesta et al. (2016).
Current usage metrics show cumulative count of Article Views (full-text article views including HTML views, PDF and ePub downloads, according to the available data) and Abstracts Views on Vision4Press platform.
Data correspond to usage on the plateform after 2015. The current usage metrics is available 48-96 hours after online publication and is updated daily on week days.
Initial download of the metrics may take a while.