Open Access
Fig. 11.
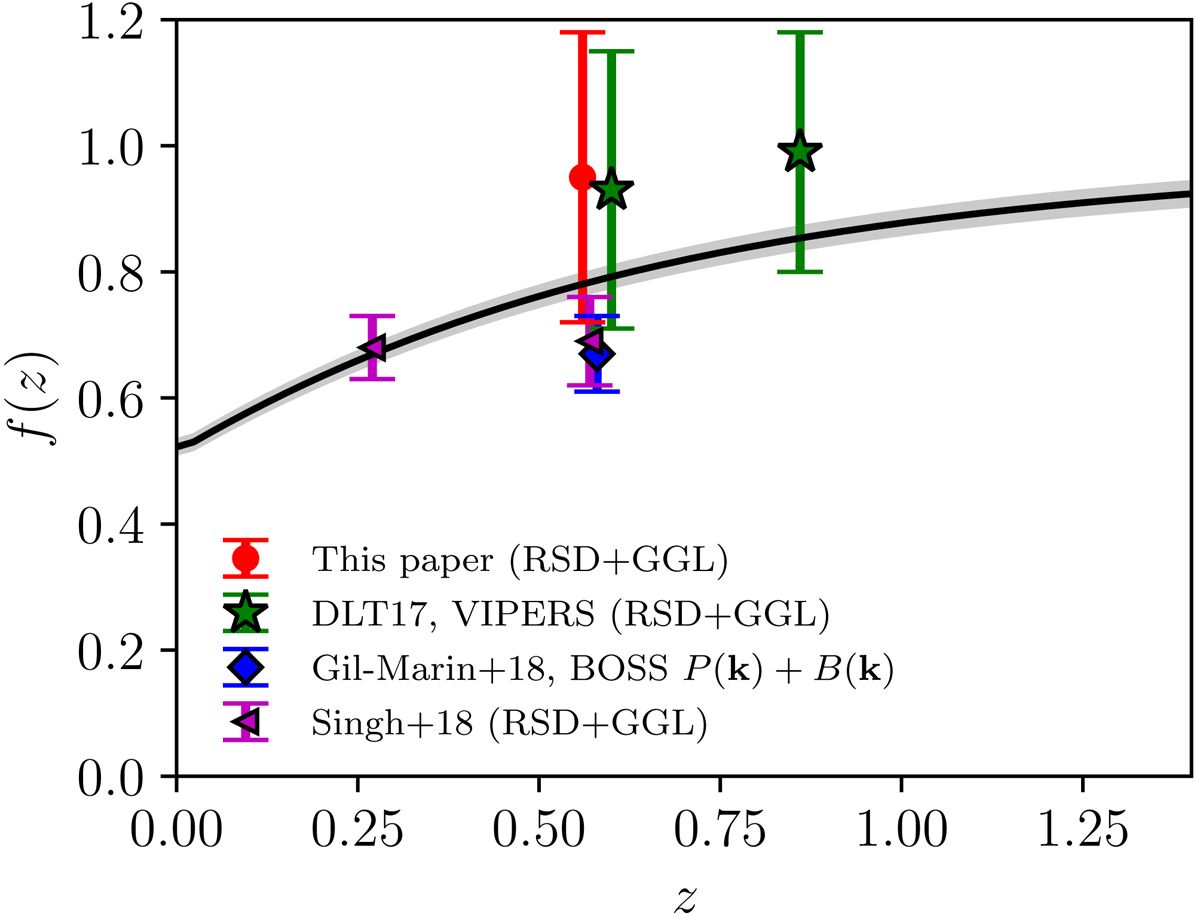
Growth rate f as a function of redshift compared to recent measurements. The black line and surrounding grey shared area indicate the Planck TT,TE,EE+lowE 2018 mean and 1σ uncertainty predictions for ΛCDM−GR flat model.
Current usage metrics show cumulative count of Article Views (full-text article views including HTML views, PDF and ePub downloads, according to the available data) and Abstracts Views on Vision4Press platform.
Data correspond to usage on the plateform after 2015. The current usage metrics is available 48-96 hours after online publication and is updated daily on week days.
Initial download of the metrics may take a while.