Free Access
Fig. 5.
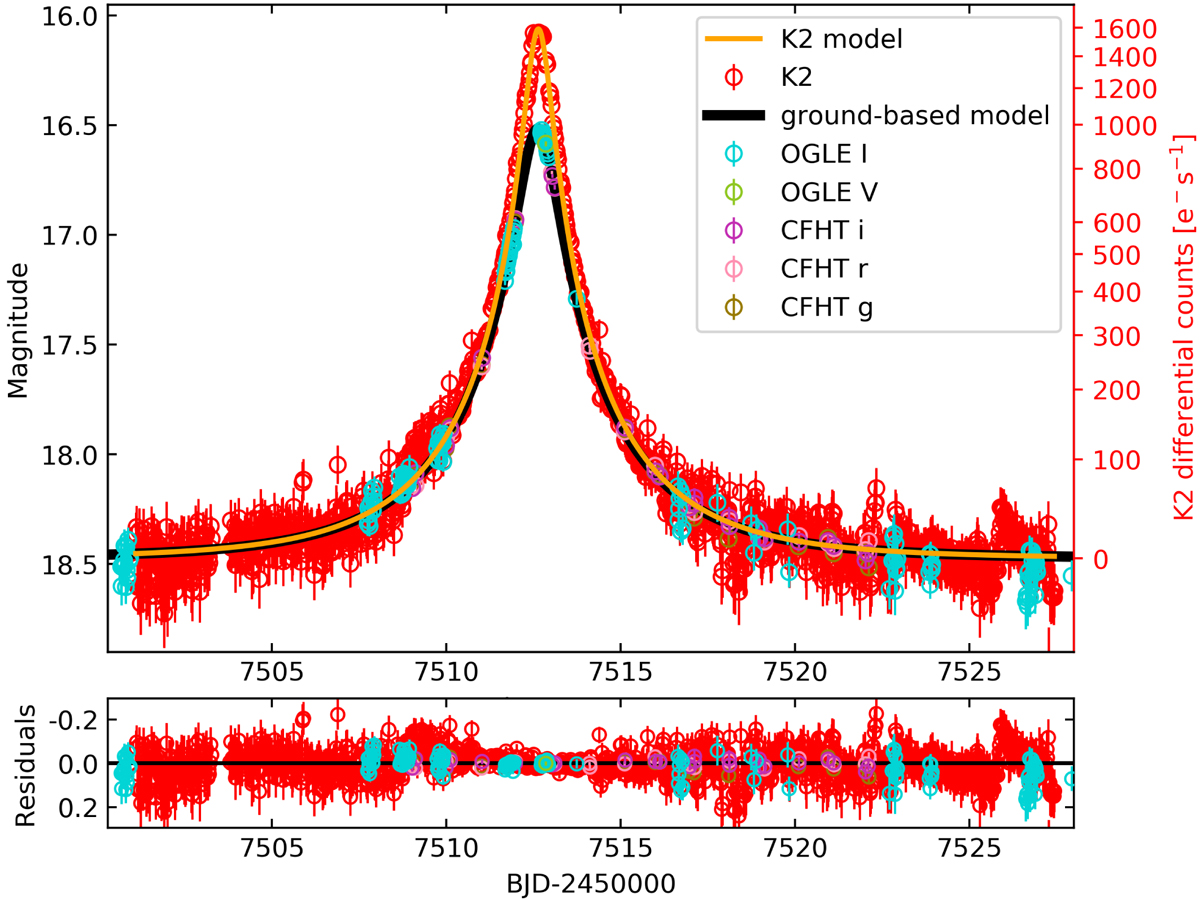
MCPM light curve of OGLE-2016-BLG-0795. The K2 light curve (red) has amplitude of 1600 counts, see bottom part of Fig. 1 for raw data. The right-hand side of the Y axis is nonlinear and shows selected K2 flux values. Compare to Fig. 9 in Zang et al. (2018).
Current usage metrics show cumulative count of Article Views (full-text article views including HTML views, PDF and ePub downloads, according to the available data) and Abstracts Views on Vision4Press platform.
Data correspond to usage on the plateform after 2015. The current usage metrics is available 48-96 hours after online publication and is updated daily on week days.
Initial download of the metrics may take a while.