Fig. 1.
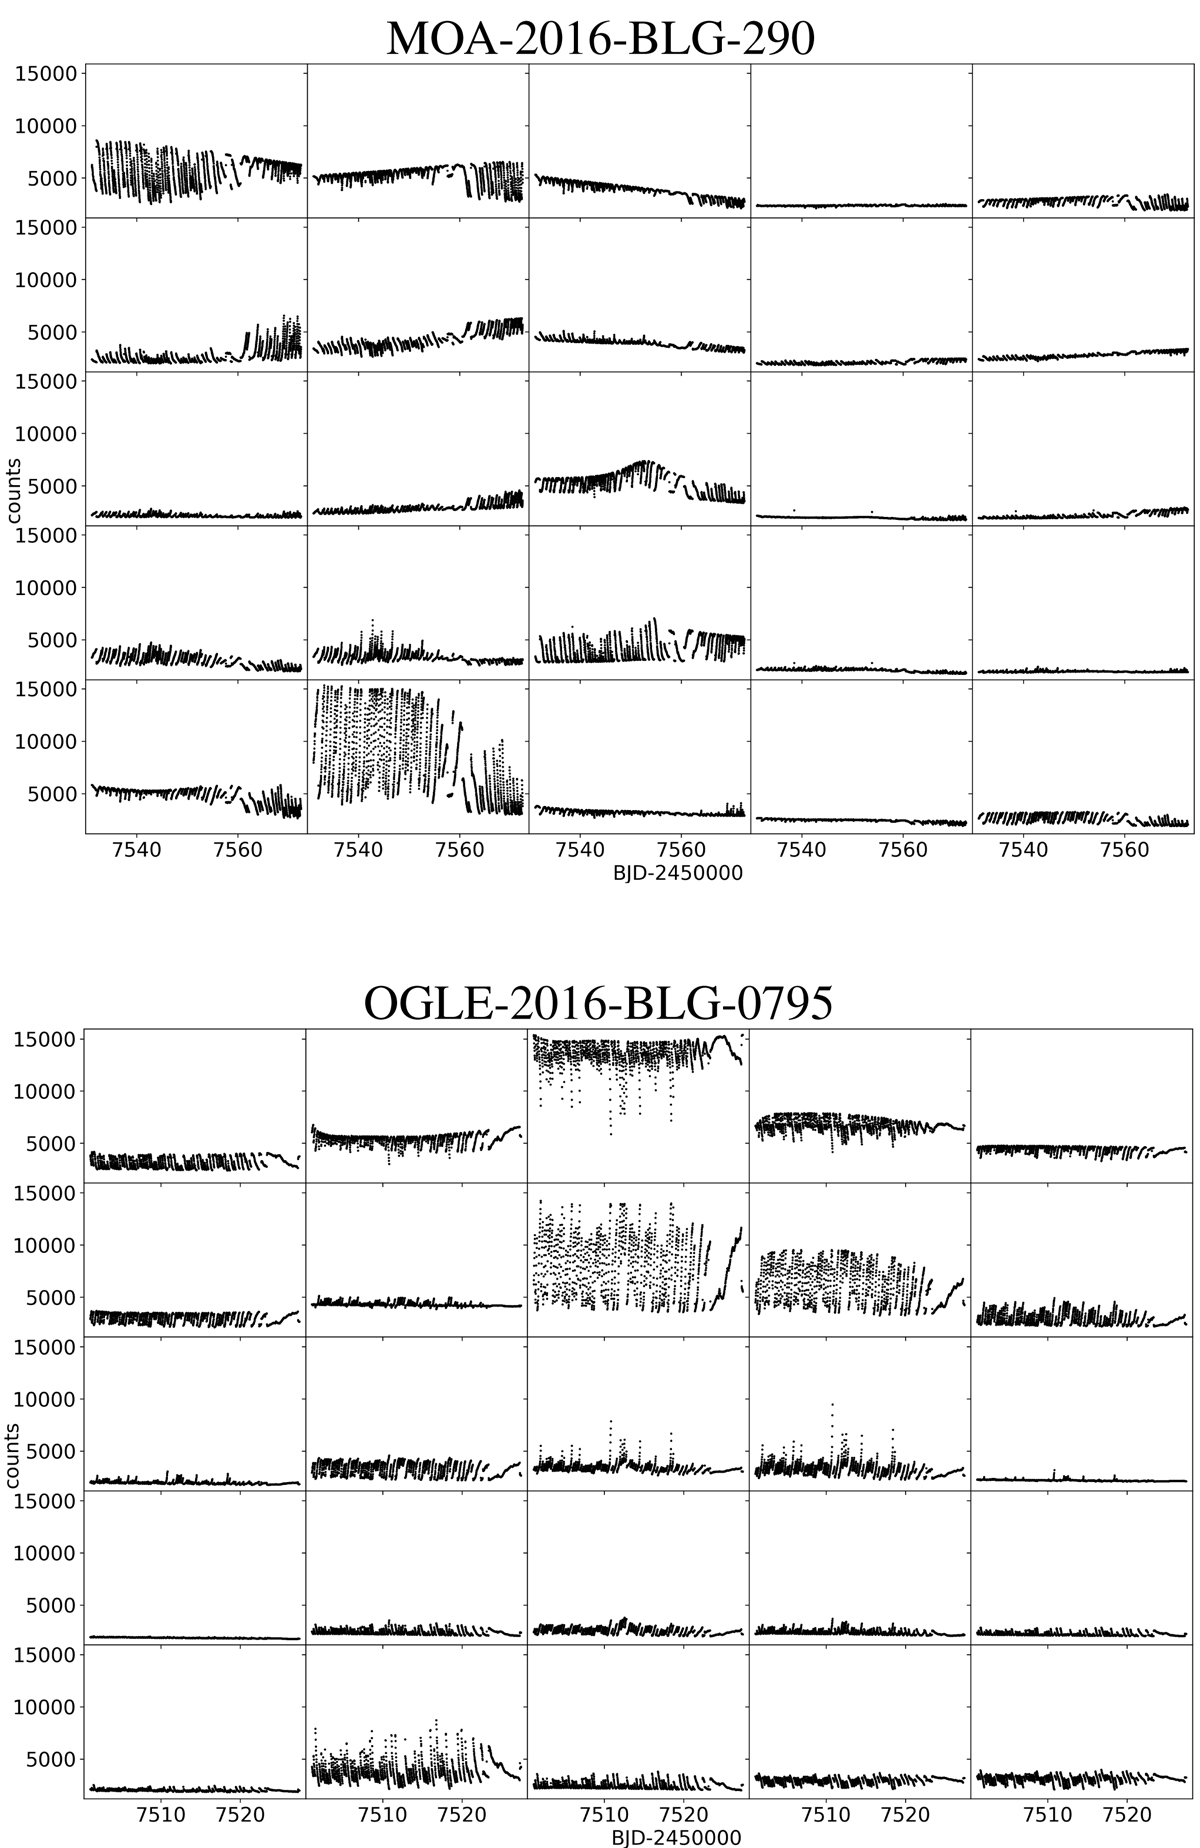
Raw light curves in 25 adjacent pixels centered on very bright microlensing event MOA-2016-BLG-290 (top, C9b) and significantly fainter event OGLE-2016-BLG-0795 (bottom, C9a). The Y-axis values (in e− s−1) are very precisely measured: the uncertainties are in the range 1.8−3.6 counts, i.e., invisible on the plot above. There are 2022 epochs in each panel of the top plot and 1278 in each panel of the bottom plot. The instrumental trends have patterns that are shared by different pixels. The instrumental trends are larger (and in many cases much larger) than the microlensing signal, as the microlensed source is usually not the brightest star in a K2 pixel. For OGLE-2016-BLG-0795 we extract photometry using the central pixel and three pixels adjacent to it (bottom, left, and right).
Current usage metrics show cumulative count of Article Views (full-text article views including HTML views, PDF and ePub downloads, according to the available data) and Abstracts Views on Vision4Press platform.
Data correspond to usage on the plateform after 2015. The current usage metrics is available 48-96 hours after online publication and is updated daily on week days.
Initial download of the metrics may take a while.