Fig. 9
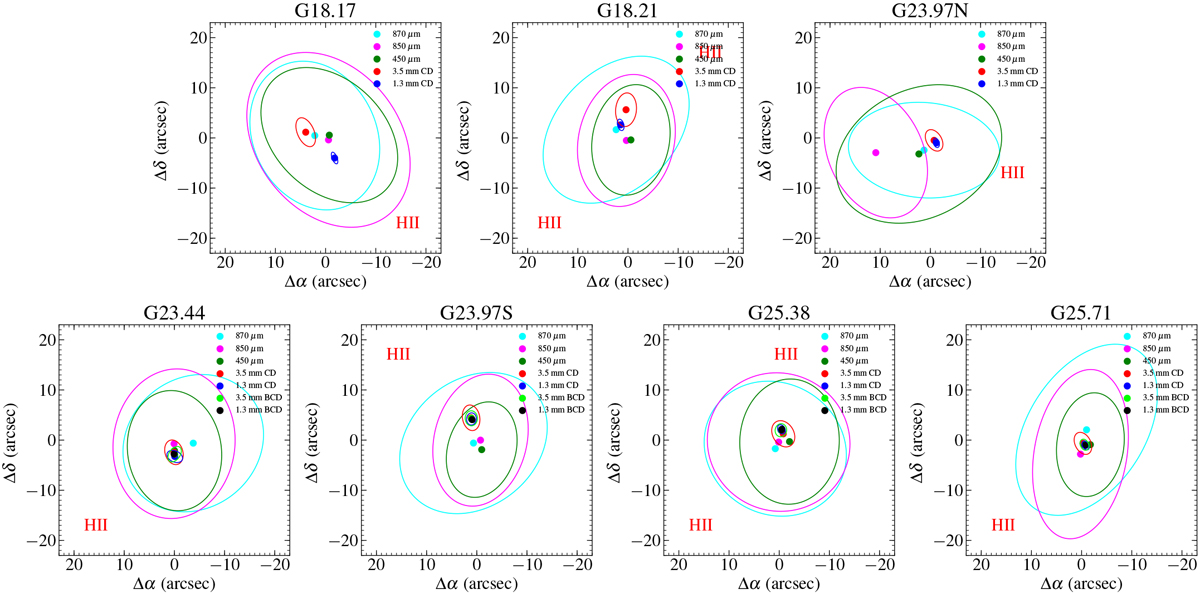
Distribution of position offset for the most massive objects (in different color points with associated ellipse) derived from different scale observations. The ellipse shows the Gaussian size of each object. The text “Hii” presents the location and direction of nearby Hii regions. The offset (0, 0) is the phase center of the observations.
Current usage metrics show cumulative count of Article Views (full-text article views including HTML views, PDF and ePub downloads, according to the available data) and Abstracts Views on Vision4Press platform.
Data correspond to usage on the plateform after 2015. The current usage metrics is available 48-96 hours after online publication and is updated daily on week days.
Initial download of the metrics may take a while.