Fig. 7
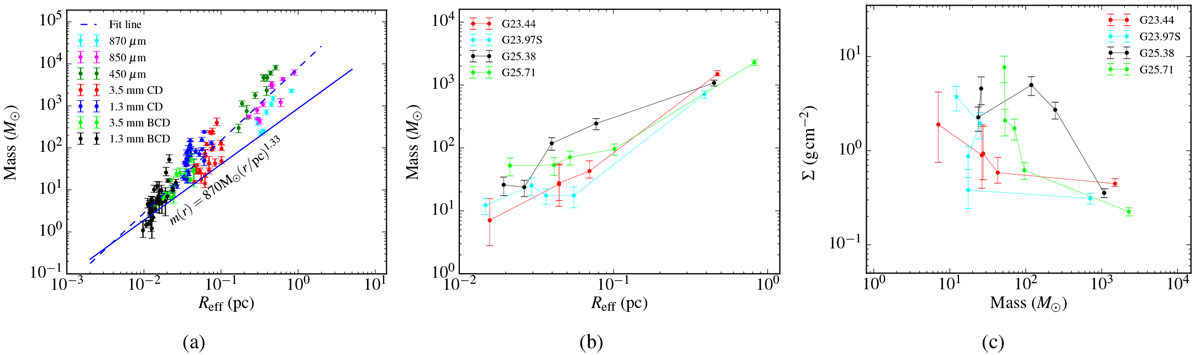
(a)Mass-size distribution of all sources at different wavelengths. (b) Mass-size. (c) Surface density-mass distributions only for the most massive objects within each clump. The straight line shows the empirical threshold for high-mass star formation (Kauffmann & Pillai 2010). The dashed line shows the result of a linear power-law fit to the whole sample: log (Mass(Reff)∕M⊙) = 3.86 + 1.68 × log (Reff∕pc) (see details in Zhang & Li 2017).
Current usage metrics show cumulative count of Article Views (full-text article views including HTML views, PDF and ePub downloads, according to the available data) and Abstracts Views on Vision4Press platform.
Data correspond to usage on the plateform after 2015. The current usage metrics is available 48-96 hours after online publication and is updated daily on week days.
Initial download of the metrics may take a while.