Free Access
Fig. 2
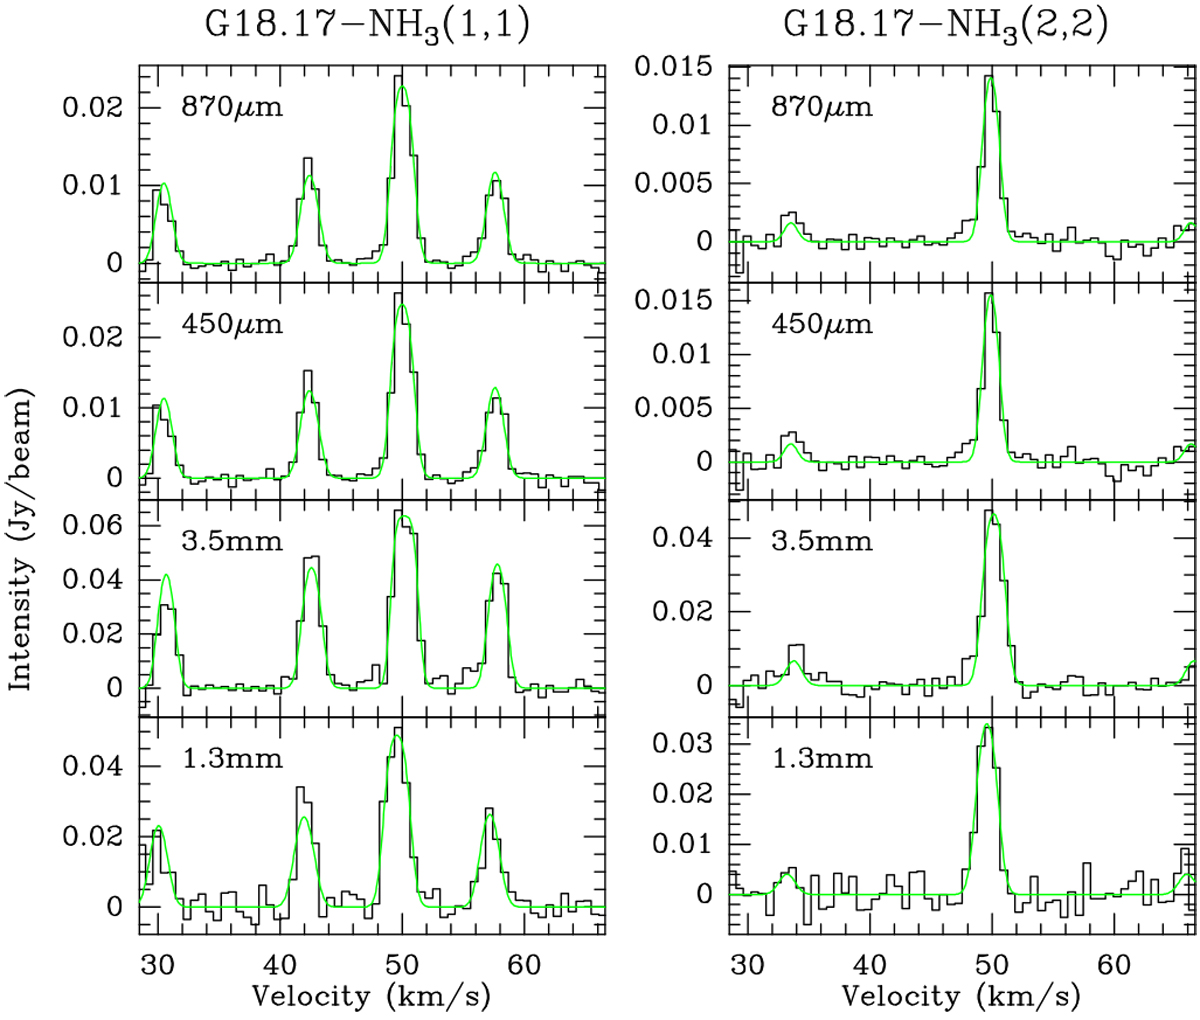
NH3 (1, 1) and (2, 2) example spectra overlaid with their HFS fits for the fragment G18.17-No. 1 (see Tables D.1–D.3). Top to bottom: the lines are averaged within different fragment scales, respectively, at 870 μm, 450 μm, 3.5 mm (CDconfiguration observations), and 1.3 mm (CD configuration observations).
Current usage metrics show cumulative count of Article Views (full-text article views including HTML views, PDF and ePub downloads, according to the available data) and Abstracts Views on Vision4Press platform.
Data correspond to usage on the plateform after 2015. The current usage metrics is available 48-96 hours after online publication and is updated daily on week days.
Initial download of the metrics may take a while.