Fig. D.4
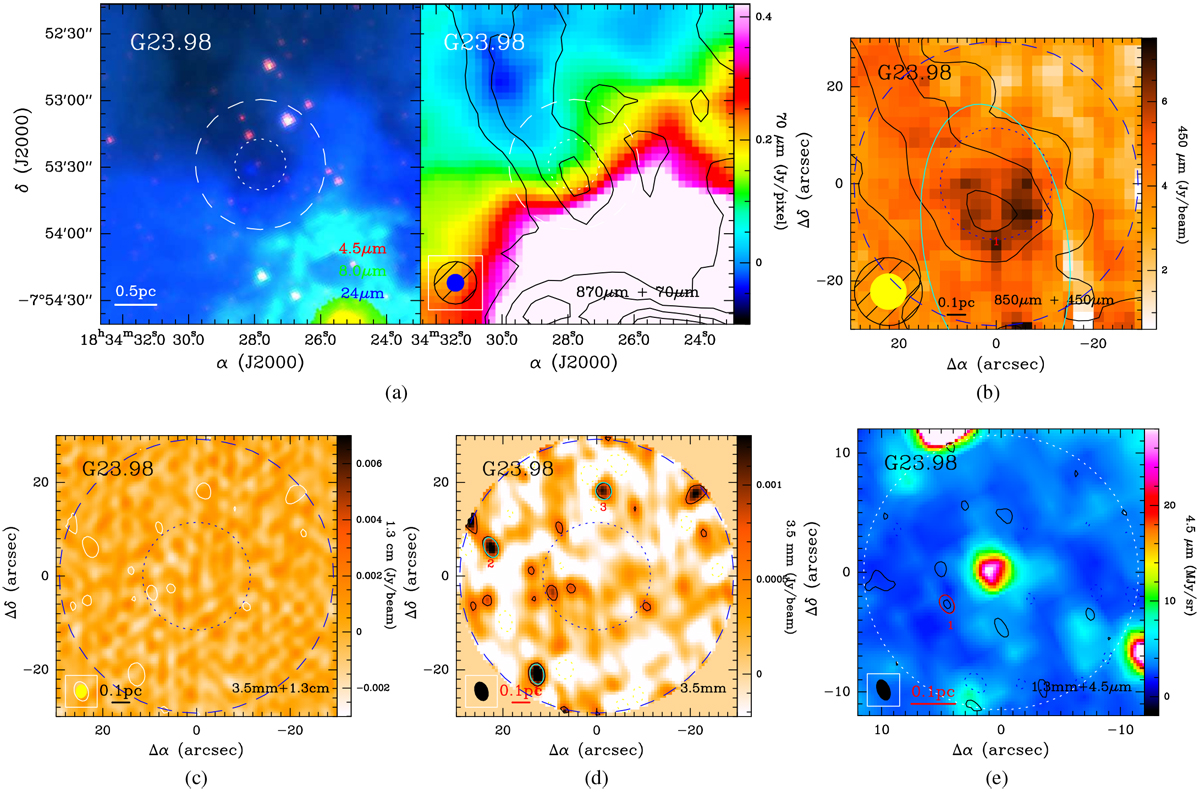
Multi-wavelength observations for source G23.98: (a) left: three-color image of 4.5 μm (blue), 8.0 μm (green), and 24 μm (red); right: 870 μm contours overlaid on a 70 μm color scale. The 870 μm contour levels start at 6σ in steps of 6σ (σ = 54 MJy beam−1). (b) 850 μm contours overlaid on a 450 μm color scale. The 850 μm contour levels start at 3.6σ in steps of 4.8σ (σ = 83 MJy beam−1). (c) 3.5 mm contours overlaid on a 1.3 cm color scale. For CD configuration observations. (d) 3.5 mm contour levels start at −3σ, 3σ in steps of 4σ (σ = 0.22 MJy beam−1). (e) 1.3 mm contour levels start at −3σ, 3σ in steps of 2σ (σ = 1.65 MJy beam−1) superimposed on a 24 μm color scale. The ellipses with numbers indicate the positions of extracted sources. The crosses in the 1.3 mm CD configuration observations indicate the positions of the corresponding 3.5 mm CD configuration observations. The dashed and dotted circles in each subfigure indicate the primary beam scales of 3.5 and 1.3 mm PdBI tracks, respectively.
Current usage metrics show cumulative count of Article Views (full-text article views including HTML views, PDF and ePub downloads, according to the available data) and Abstracts Views on Vision4Press platform.
Data correspond to usage on the plateform after 2015. The current usage metrics is available 48-96 hours after online publication and is updated daily on week days.
Initial download of the metrics may take a while.