Fig. A.1.
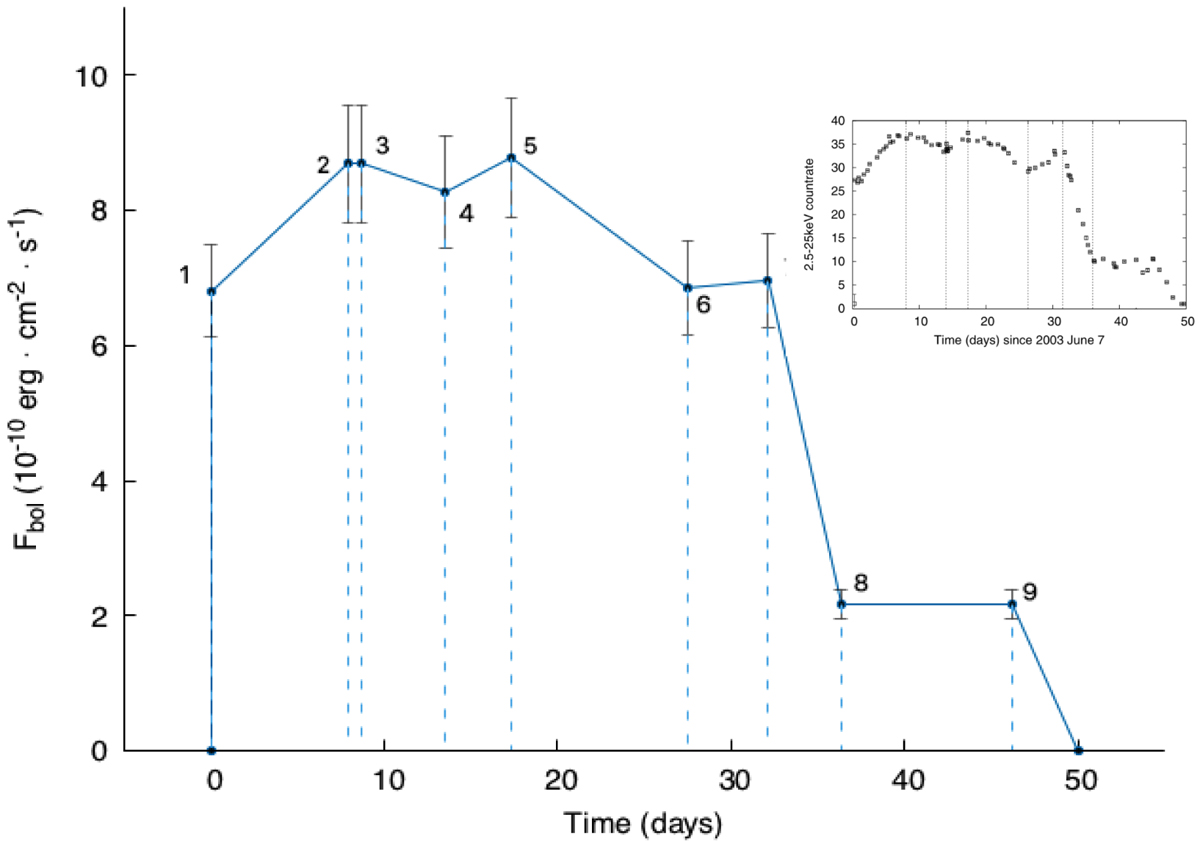
Data points used to describe geometrically the light curve of the 2003 outburst of XTE J1814−338. In this representation, the light curve is described as the piecewise function connecting the data points and its area is obtained by dividing it into trapezes, whose vertical lines are the dashed lines in this figure, and summing their areas; the light curve is shown for comparison in the box above (Papitto et al. 2007).
Current usage metrics show cumulative count of Article Views (full-text article views including HTML views, PDF and ePub downloads, according to the available data) and Abstracts Views on Vision4Press platform.
Data correspond to usage on the plateform after 2015. The current usage metrics is available 48-96 hours after online publication and is updated daily on week days.
Initial download of the metrics may take a while.