Fig. 5
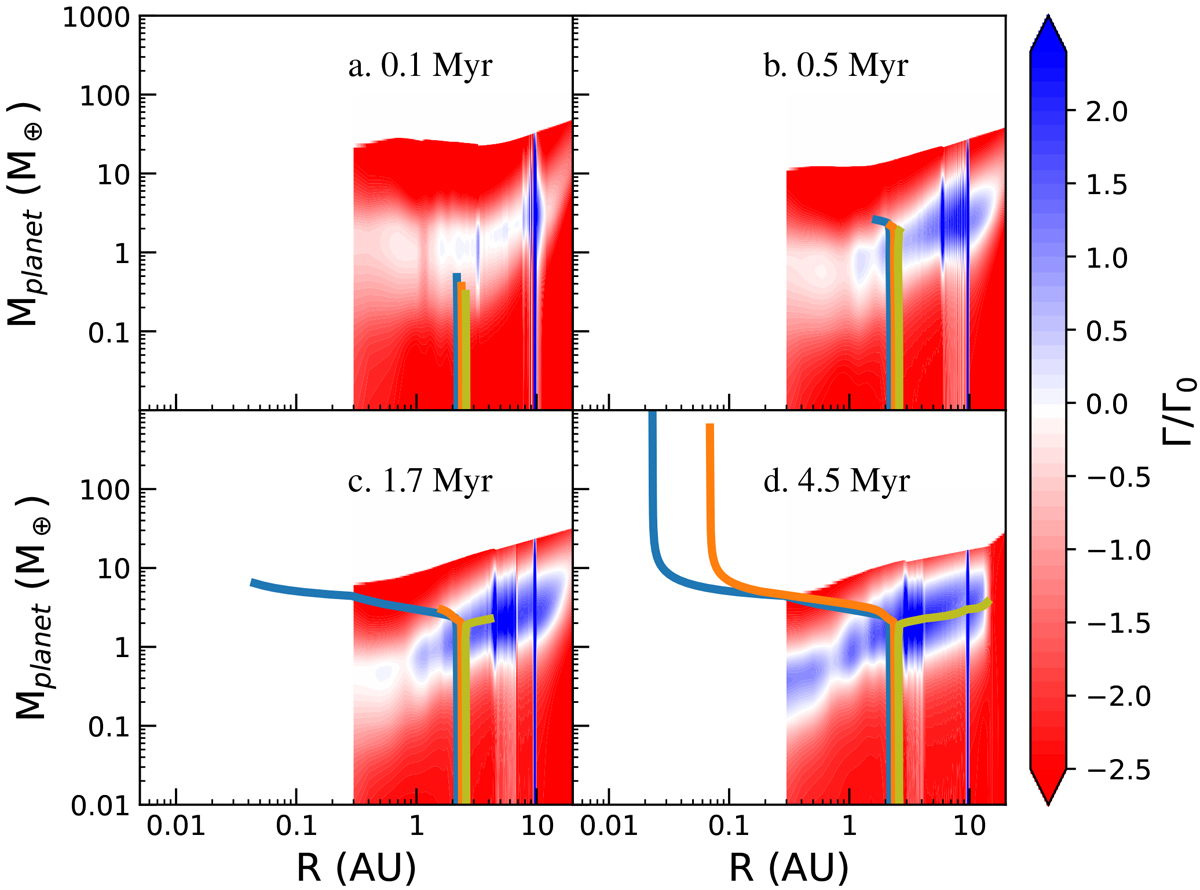
Combined torque maps and planet formation tracks for four different snapshots throughout the formation history of our three planets of interest. In the torque maps (colored region) red denotes inward migration, white denotes zero net torque, and blue denotes outward migration. The band of outward migration between 1 and 10 AU is caused by our choice of disk model and the opacity arising from CO2 freeze out.
Current usage metrics show cumulative count of Article Views (full-text article views including HTML views, PDF and ePub downloads, according to the available data) and Abstracts Views on Vision4Press platform.
Data correspond to usage on the plateform after 2015. The current usage metrics is available 48-96 hours after online publication and is updated daily on week days.
Initial download of the metrics may take a while.