Free Access
Fig. 1
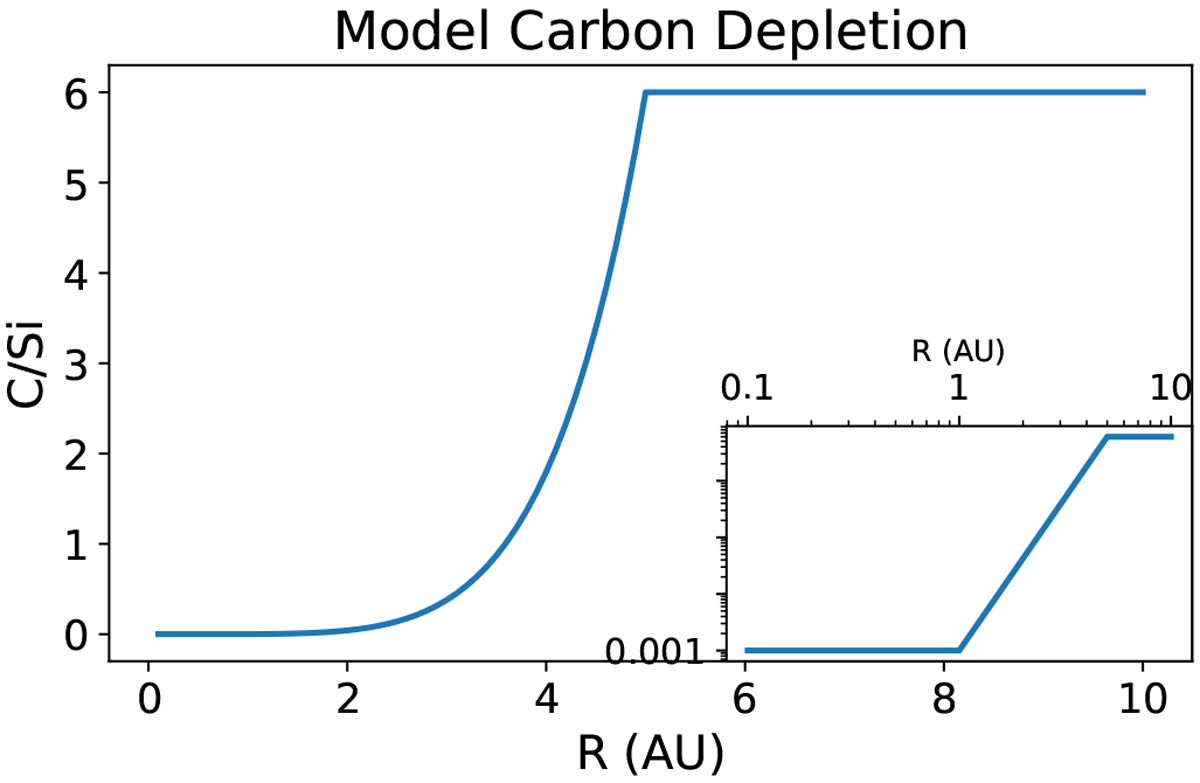
Radial dependency of carbon depletion as described in Eq. (3). The inset shows the same plot in log-space, mimicking Fig. 2 of Mordasini et al. (2016).
Current usage metrics show cumulative count of Article Views (full-text article views including HTML views, PDF and ePub downloads, according to the available data) and Abstracts Views on Vision4Press platform.
Data correspond to usage on the plateform after 2015. The current usage metrics is available 48-96 hours after online publication and is updated daily on week days.
Initial download of the metrics may take a while.