Fig. 2.
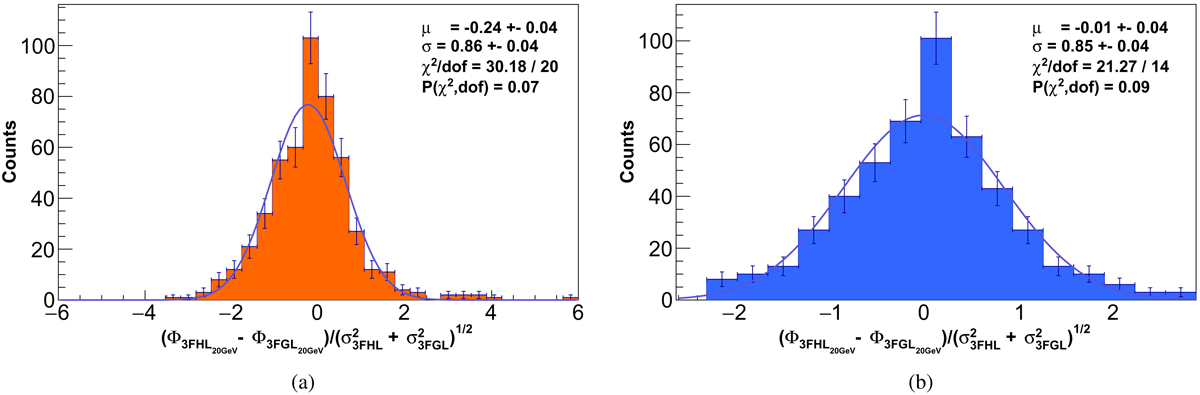
Distribution of the normalized difference between the flux at 20 GeV from the 3FGL and 3FHL catalogs before (panel a) and after (panel b) the correction (see text for details). A Gaussian function has been fit to both histograms; the mean of the distributions, μ, quantifies the mismatch between the fluxes reported in the two catalogs.
Current usage metrics show cumulative count of Article Views (full-text article views including HTML views, PDF and ePub downloads, according to the available data) and Abstracts Views on Vision4Press platform.
Data correspond to usage on the plateform after 2015. The current usage metrics is available 48-96 hours after online publication and is updated daily on week days.
Initial download of the metrics may take a while.