Fig. 1.
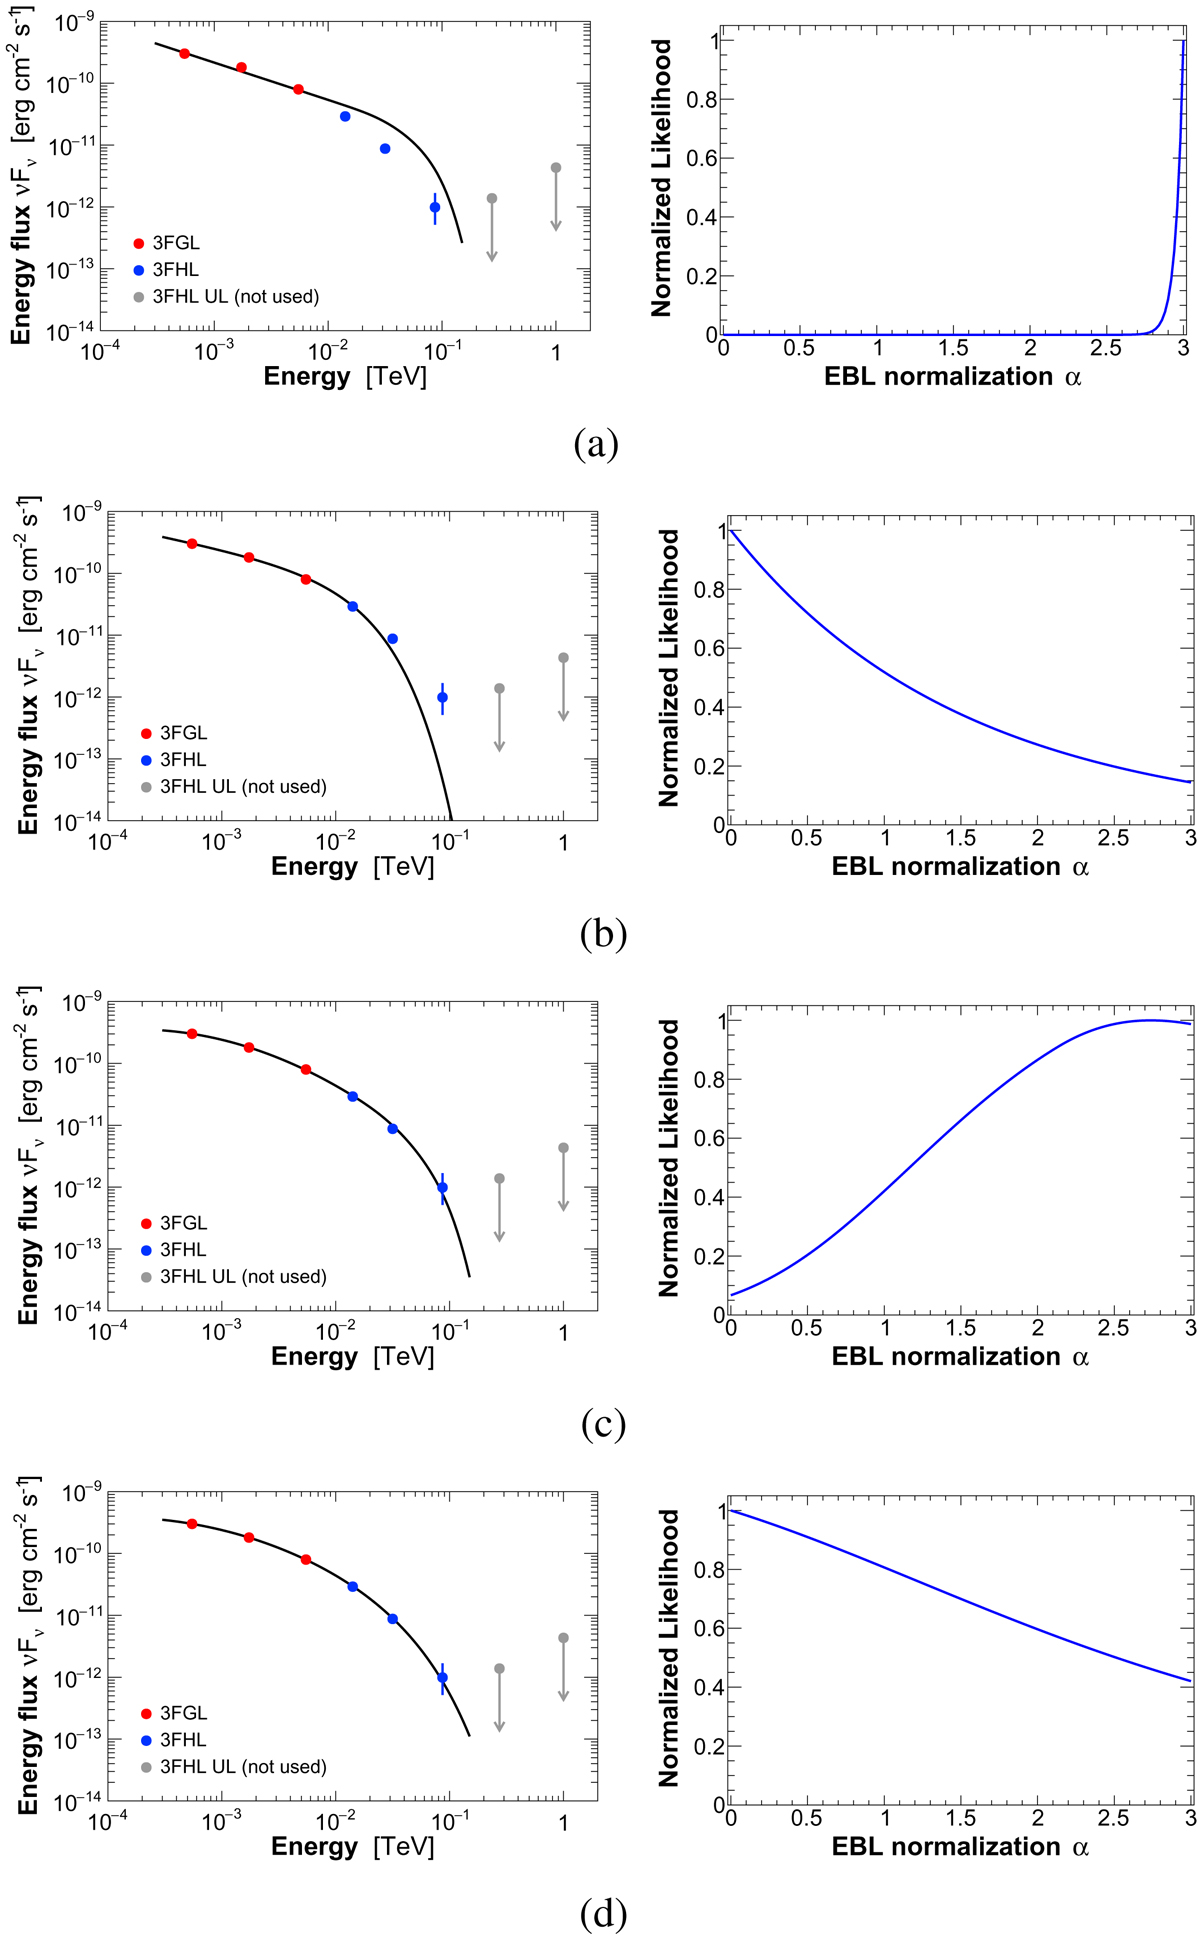
Left panels: 3FHL J2253.9+1608 spectrum, including points from the 3FGL catalog (red), and from 3FHL catalog (blue); upper limits (not included in the fit) are shown in gray. The spectral fit is displayed for the best EBL normalization over the range of interest, and has been performed modeling the intrinsic spectrum with a power law (a), an exponential cutoff power law (b), a log-parabola (c), and an exponential cutoff log-parabola (d). Right panels: likelihood profile as a function of the EBL normalization, α.
Current usage metrics show cumulative count of Article Views (full-text article views including HTML views, PDF and ePub downloads, according to the available data) and Abstracts Views on Vision4Press platform.
Data correspond to usage on the plateform after 2015. The current usage metrics is available 48-96 hours after online publication and is updated daily on week days.
Initial download of the metrics may take a while.